14
$\begingroup$

Let's say I am calculating heights (in cm) and the numbers must be higher than zero.

Here is the sample list:

0.77132064
0.02075195
0.63364823
0.74880388
0.49850701
0.22479665
0.19806286
0.76053071
0.16911084
0.08833981

Mean: 0.41138725956196015
Std: 0.2860541519582141

In this example, according to the normal distribution, 99.7% of the values must be between ±3 times the standard deviation from the mean. However, even twice the standard deviation becomes negative:

-2 x std calculation = 0.41138725956196015 - 0.2860541519582141 x 2 = -0,160721044354468

However, my numbers must be positive. So they must be above 0. I can ignore negative numbers but I doubt this is the correct way to calculate probabilities using standard deviation.

Can someone help me to understand if I am using this in correct way? Or do I need to chose a different method?

Well to be honest, math is math. It doesn't matter if it is normal distribution or not. If it works with unsigned numbers, it should work with positive numbers as well! Am I wrong?

EDIT1: Added histogram

To be more clear, I have added my real data's histogram enter image description here
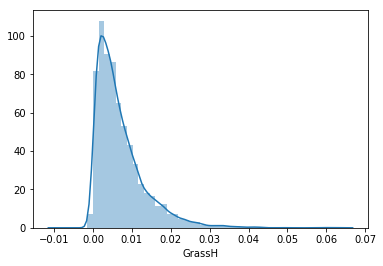
EDIT2: Some values

Mean: 0.007041500928135767
Percentile 50: 0.0052000000000000934
Percentile 90: 0.015500000000000047
Std: 0.0063790857035425025
Var: 4.06873389299246e-05
$\endgroup$
12
  • 28
    $\begingroup$ I think that the misunderstanding here is that a distribution that can only have positive numbers is not normal, so the 99.7% rule you states doesn't apply. Second, from the (sample) standard deviation formula, you can see that there is no condition on any of the original values being positive - so why should it be wrong? It may be that it is used wrongly, but statistics are mostly agnostic and shouldn't be applied mindlessly. $\endgroup$
    – Momo
    Commented Jul 15, 2018 at 14:00
  • 8
    $\begingroup$ The beauty of the 68-95-99.7 rule, @Momo, is that it does apply even to many decidedly non-Normal distributions. In this case 50% of the numbers are within 1 sd of the mean and 100% are within 2 sds of the mean. Observe that 68% accurately approximates 50% and 95% accurately approximates 100% to within the deviations we would expect of such a small dataset. Thus, this example does illustrate the rule of thumb, even though it might be a little unconvincing due to its small size. $\endgroup$
    – whuber
    Commented Jul 15, 2018 at 14:24
  • 2
    $\begingroup$ I agree. Let me correct this to "so the 99.7% rule you state doesn't necessarily apply". The source of the confusion here seems applying this as something more than a rule of thumb and not in terms of your nuanced "approximately to within the deviations we would expect". OPs last comment just shows that. $\endgroup$
    – Momo
    Commented Jul 15, 2018 at 15:05
  • 4
    $\begingroup$ Should the title be changed to something like "How to apply the 68-95-99.7 rule to data that has to be positive"? I think that captures more of the spirit of the question. (It isn't a problem with the way that standard deviation is being calculated, which is what the title suggests, but rather the way it is being used to find probabilities.) $\endgroup$
    – Silverfish
    Commented Jul 15, 2018 at 17:21
  • 4
    $\begingroup$ Standard deviation isn't "wrong". What's less accurate is treating as normal things which are not; the proportions outside a given number of standard deviations implied by normality will not always be accurate for other distributions. For continuous unimodal distributions, close to 2 standard deviations the two-sided intervals are often pretty reasonable, but further away the tail probabilities can have very high relative errors. $\endgroup$
    – Glen_b
    Commented Jul 16, 2018 at 1:45

11 Answers 11

24
$\begingroup$

If your numbers can only be positive, then modeling them as a normal distribution may not be desirable depending on your use case, because the normal distribution is supported on all real numbers.

Perhaps you would want to model height as an exponential distribution, or maybe a truncated normal distribution?

EDIT: After seeing your data, it really looks like it might fit an exponential distribution well! You could estimate the $ \lambda $ parameter by taking, for example, a maximum likelihood approach.

$\endgroup$
14
  • 11
    $\begingroup$ The first sentence is not correct in general: Many quantities that are strictly positive can often be approximated by a normal distribution. If the probability mass below 0 is very small, it doesn't matter for all practical purposes. In this particular case, it's certainly right. $\endgroup$ Commented Jul 15, 2018 at 14:05
  • 14
    $\begingroup$ -1 This answer reflects a widely held (and imho pernicious) misconception about what a statistical model is and what it really means to model data with a Normal distribution. Indeed, if we were to believe what this post says, then it would "certainly incorrect" ever to approximate a Binomial distribution with a Normal distribution--but this is historically the original and likely most widespread use of the Normal distribution! (Edit: I removed the downvote because you modified the original claim into one that is much more correct and useful.) $\endgroup$
    – whuber
    Commented Jul 15, 2018 at 14:15
  • 4
    $\begingroup$ It depends on what you mean by "superior." Part of the cost of a model lies in what it takes to implement it. If you adopt a truncated Normal model, you're probably committing yourself to a lot of custom numerical calculations instead of quick, easy, and perhaps beautifully accurate analytical calculations. Another purpose of a model is to provide insight: one thinks, "if nature behaves at least approximately like these assumptions, then what consequences can be inferred from those assumptions?" Often, making such inferences is easier with a simple approximation. $\endgroup$
    – whuber
    Commented Jul 15, 2018 at 14:17
  • 2
    $\begingroup$ @whuber: after "beautifully accurate" I mentally added "wrong". Sorry. Of course, also "but useful" per Box. $\endgroup$ Commented Jul 15, 2018 at 14:41
  • 2
    $\begingroup$ Even though the data consist of non-integer values? $\endgroup$
    – Kevin Li
    Commented Jul 16, 2018 at 18:30
21
$\begingroup$

"What is the correct way to apply 68-95-99.7 to my case?"

One should only expect that rule of thumb for the coverage to apply exactly only if you are (1) looking at the entire (infinite) population or theoretical probability distribution, and (2) the distribution is exactly normal.

If you take a random sample of size 20, even from a genuinely normal distribution, you won't always find that 95% of the data (19 of the 20 items) lies within 2 (or 1.960) standard deviations of the mean. In fact it is neither guaranteed that 19 of the 20 items will lie within 1.960 population standard deviations of the population mean, nor that 19 of the 20 items lie within 1.960 sample standard deviations of the sample mean.

If you take a sample of data from a distribution that is not quite normally distributed, then again one would not expect the 68-95-99.7 rule to apply exactly. But it may come reasonably close to doing so, particularly if the sample size is large (the "99.7% coverage" rule-of-thumb may not be especially meaningful with a sample size below 1000) and the distribution is reasonably close to normality. In theory lots of data such as height or weight could not come from a precisely normal distribution or that would imply a small, but non-zero, probability of them being negative. Nevertheless, for data with an approximately symmetrical and unimodal distribution, where middling values are more common and extremely high or low values drop off in probability, the model of a normal distribution may be adequate for practical purposes. Incidentally you may be interested in If my histogram shows a bell-shaped curve, can I say my data is normally distributed?

If you want theoretically binding bounds that apply to any distribution, then see Chebyshev's inequality, which states that at most $1/k^2$ of the values can lie more than $k$ standard deviations from the mean. This guarantees that at least 75% of data lie within two standard deviations of the mean, and 89% within three standard deviations. But those figures are just the theoretically-guaranteed minimum. For many roughly bell-shaped distributions, you will find that the two-standard deviation coverage figure comes much closer to 95% than to 75%, and so the "rule of thumb" from the normal distribution is still useful. On the other hand, if your data come from a distribution that is nowhere near bell-shaped, you may be able to find an alternative model that describes the data better and has a different coverage rule.

(One thing that is nice about the 68-95-99.7 rule is that it applies to any normal distribution, regardless of its parameters for mean or standard deviation. Similarly, Chebyshev's inequality applies regardless of the parameters, or even the distribution, though only gives lower bounds for coverage. But if you apply, for example, a truncated normal or skew normal model, then there isn't a simple equivalent of "68-95-99.7" coverage, because it would depend upon the parameters of the distribution.)

$\endgroup$
7
$\begingroup$

Can someone help me to understand if i am using this in correct way?

Oh, that's easy. No, you're not using it correctly.

First off, you're using a rather small data set. Trying to tease out statistical behavior from this size set is certainly possible, but the confidence bounds are (ahem) rather large. For small data sets, deviations from the expected distributions are par for the course, and the smaller the set the greater the problem. Remember, "The Law of Averages not only permits the most outrageous coincidences, it requires them."

Worse, the particular data set you're using simply doesn't look much like a normal distribution. Think about it - with a mean of .498 you've got two samples below 0.1, and three more at .748 or above. Then you've got a cluster of 3 points between .17 and .22. Looking at this particular data set and arguing that it must be normal distribution is a pretty good case of Procrustean argument. Does that look like a bell curve to you? It's perfectly possible that the larger population does follow a normal, or modified normal, distribution, and a larger sample size would address the issue, but I wouldn't bet on it, particularly without knowing more about the population.

I say modified normal, since as Kevin Li has pointed out, technically a normal distribution includes all real numbers. As was also pointed out in comments to his answer, this does not prevent applying such a distribution over a limited range and getting useful results. As the saying goes, "All models are wrong. Some are useful."

But this particular data set simply doesn't look like inferring a normal distribution (even over a limited range) is a particularly good idea. If your 10 data points looked like .275,.325,.375,.425,.475,.525,.575,.625,.675,.725 (mean of 0.500), would you assume a normal distribution?

$\endgroup$
4
  • $\begingroup$ I have used a random data to be able to explain my needs and problem $\endgroup$
    – Don Coder
    Commented Jul 15, 2018 at 16:10
  • 1
    $\begingroup$ @DonCoder Random data (unless you tweaked it in some way) would follow the uniform distribution, not the normal distribution. $\endgroup$
    – user1566
    Commented Jul 15, 2018 at 16:13
  • 5
    $\begingroup$ Random data needs to be generated from some distribution. Which did you choose? $\endgroup$
    – Peter Flom
    Commented Jul 15, 2018 at 16:59
  • $\begingroup$ I have added the histogram of my real data $\endgroup$
    – Don Coder
    Commented Jul 15, 2018 at 22:35
2
$\begingroup$

In one of the comments you say you used "random data" but you don't say from what distribution. If you are talking about heights of humans, they are roughly normally distributed, but your data are not remotely appropriate for human heights - yours are fractions of a cm!

And your data are not remotely normal. I'm guessing you used a uniform distribution with bounds of 0 and 1. And you generated a very small sample. Let's try with a bigger sample:

set.seed(1234)  #Sets a seed
x <- runif(10000, 0 , 1)
sd(x)  #0.28

so, none of the data is beyond 2 sd from the mean, because that is beyond the bounds of the data. And the portion within 1 sd will be approximately 0.56.

$\endgroup$
1
$\begingroup$

Often, when you have a constraint that your samples must all be positive, it is worth looking at the logarithm of your data to see if your distribution can be approximated by a lognormal distribution.

$\endgroup$
1
$\begingroup$

A standard deviation calculation is relative to the mean. Can you apply standard deviation to numbers which are always positive? Absolutely. If you were to add 1000 to each of the values in your sample set, you would see the same standard deviation value, but you will have provided yourself with more breathing room above zero.

$$\displaystyle s={\sqrt {\frac {\sum _{i=1}^{N}(x_{i}-{\overline {x}})^{2}}{N-1}}} = {\sqrt {\frac {\sum _{i=1}^{N}((x_{i}+k)-({\overline {x}}+k))^{2}}{N-1}}}$$

However, adding an arbitrary constant to your data is superficial. When using standard deviation for a data set so small, you will need to expect unrefined output. Consider the standard deviation like an auto-focus camera lens: the more time (data) you give it, the clearer the picture will be. If after you track 1000000 data points, your mean and standard deviation remain the same as with 10, then I may start to question the validity of your experiment.

$\endgroup$
1
$\begingroup$

Your histogram shows that the normal distribution is not a good fit. You could try lognormal or something else that is asymmetrical and strictly positive

$\endgroup$
1
$\begingroup$

The main point is that a lot of us are lazy*, and the normal distribution is convenient to work with for us lazy people. It is easy do calculations using normal distribution and it has nice mathematical foundation. As such it is a "model" for how to work on data. This model often works surprisingly well, and sometimes falls flat on its face.

It is very obvious that your samples do not indicate a normal distribution in the data. So the solution to you dilemma is to choose a different "model", and work with a different distribution. Weibull distributions may be on direction, there are others.

  • lazy in not really getting to know the data and selecting better models when necessary.
$\endgroup$
0
$\begingroup$

Basically you are using Ratio data as opposed to Interval data. Geographers go through this all the time when calculating the S/D for annual rainfall at a specific location (100+ years of sample points at say L.A. Civic Center) or snowfall (100+ years of snowfall samples at Big Bear Lake). We can only have positive numbers, that's just the way it is.

$\endgroup$
0
$\begingroup$

In meteorology, distributions of wind speeds do look a lot like this. By definition wind speeds are also non-negative.

So in your case, i would definitely look at the Weibull distribution.

$\endgroup$
0
$\begingroup$

You start with "according to the normal distribution" when your data is clearly not normal distributed, that's the first problem. You say "It doesn't matter if it is normal distribution or not." Which is absolute nonsense. You can't use statements about normal distributed data if your data is not normal distributed.

And you misinterpret the statement. "99.7% must be within three standard deviations". And 99.7% of your data was indeed within three standard deviations. Even better, it was 100% within two standard deviations. So the statement is true.

$\endgroup$

Your Answer

By clicking “Post Your Answer”, you agree to our terms of service and acknowledge you have read our privacy policy.

Not the answer you're looking for? Browse other questions tagged or ask your own question.