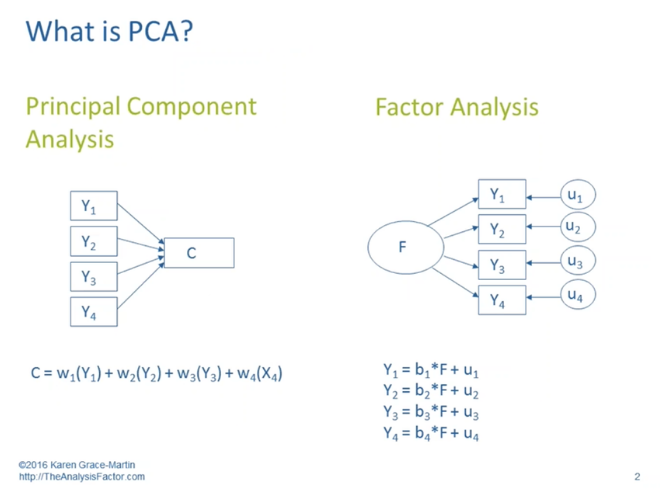
Interpretation 1. would apply not to principal components analysis (PCA) but would to factor analysis (EFA). Interpretation 2. is correct for PCA and in a sense for EFA. Moreover, I think it's important to view the diagram as reflecting two competing models or frameworks for describing sets of relationships.
Typically, or classically, when we adopt a PCA model or framework for approaching relationships, we seek data reduction. We look for ways in which a set of observed, measured variables such as Y1 through Y4 can be conveniently described by a smaller number of dimensions/topics/components such as C. When working in this mode we typically do not try to make causal statements about these relationships; more often we are trying to condense the number of variables we are working with. We also don't fully account for (don't fully exclude the information in) variables like u1 through u4, which entail some combination of information specific to a given Y and information resulting from measurement error. Since it makes fewer such distinctions, PCA is used most effectively when we are dealing with objective and error-free variables--e.g. (theoretically), consumer price index rather than consumer optimism.
And then typically, or classically, when we adopt a FA model or framework (in fact in this case it's better if we say exploratory factor analysis or EFA), we seek unmeasured, hidden, or latent causes that can account for our observed, measured variables. Suppose research on clinical depression suggested that there were three dimensions of depression, each with the capacity to cause its own types of symptoms. A person's low position on a supposed emotional dimension might account for low mood and self-hatred; on a cognitive dimension, difficulty concentrating and making decisions; and on a physical dimension, fatigue and insomnia and aches and pains.
The Y-variables with the highest loadings on factor F can be considered, under this model, to be the ones more dependent on F, or caused by F. Thus interpretation 1. seems to apply to EFA. And then 2. fits EFA because the higher a variable's loading on factor F, the more that variable will affect a person's score on factor F. Such a variable, in standardized form, will have a larger weight in a regression equation that produces the factor score.
(For much more detail, see What are the differences between Factor Analysis and Principal Component Analysis? or Is there any good reason to use PCA instead of EFA? Also, can PCA be a substitute for factor analysis?.)

