According to Filzmoser et al. 2009, the best way to conduct a principal component analysis for compositional data with outliers is:
- using a robust PCA method
- and using the isometric log ratio transformation (instead of the centred log ratio transformation, see also the discussion here).
The function pcaCoDa() from the R package robCompositions can do both things.
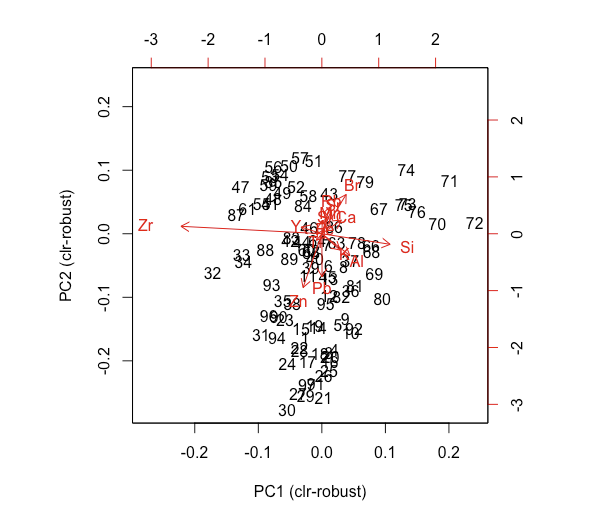
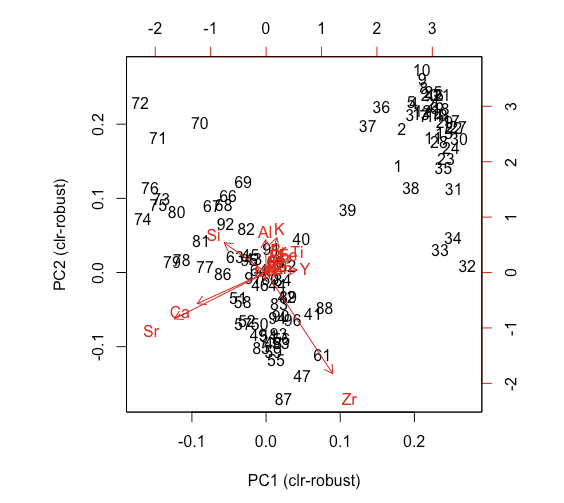
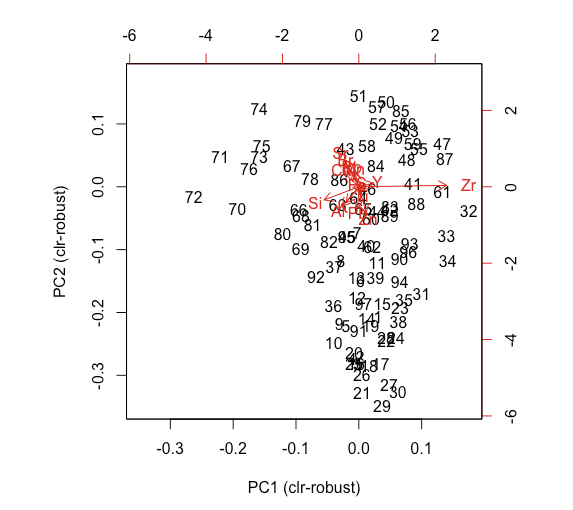
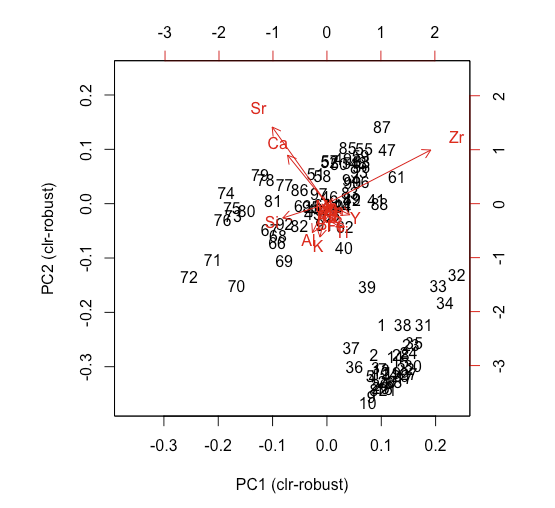
However, every time I run the function, I get a different result... how is that possible?
Examples from four different runs:
In some of the biplots above, it's just a matter of the components being rotated, but for others, I don't think that's the case.
Also, for what I understand checking help(pcaCoDa), the data set that you provide to the function must not be transformed - the transformation is done internally. But how about scaling? Should we scale the matrix before running the pcaCoDa() if the different columns use very different units?


