2
$\begingroup$

I have 20 people I wish to give performance score every 6 months. I want to identify the weakest performers in the bottom 10 and remove them from the group but only those from the point of the most significant drop in performance. I am willing to accept there may well be a perfectly linear decline in score with no sudden drop however my thinking is that by obtaining the standard deviation amongst the top 10 I can identify the greatest precipice drop amongst the bottom ten.

Is standard deviation the correct term to use and how would I go about calculating this ?

$\endgroup$
4
  • $\begingroup$ Is your purpose (a) to identify (according to some criterion) the 'worst' performers every 6 months in order to fire, re-train, re-motivate, chastise, or demote them? Or (b) to get an interval estimate of the overall ability of the group, disregarding some low outliers? // If (a), you'd need to articulate a criterion that's more specific than detecting a hypothetical 'sudden drop'. Maybe boxplot low outliers would be more useful than something based on the SD. // If (b), what is the purpose of the estimate? $\endgroup$
    – BruceET
    Commented Nov 12, 2018 at 21:37
  • $\begingroup$ @BruceET Thanks for your response. The purpose is to fire them and have them replaced so I guess (a). However I do not wish to fire anyone is there is only a small performance gap between the top performer and the bottom. Also I would not seek to remove anyone in a scenario where the 20 scores were as follows: 100, 93, 90, 89, 87, 86, 68, 67, 59, 58, 57, 56, 55, 53, 49, 48, 47, 45, 44, 43 (because the biggest gap was not among the bottom 10). $\endgroup$ Commented Nov 12, 2018 at 21:53
  • $\begingroup$ Is your firing criterion entirely relative to others in the group in a particular 6-month period, or is there a lowest score based on long-term experience that is really unacceptable? Can you quantify what you mean by a 'big gap' or is that re-established every six months? $\endgroup$
    – BruceET
    Commented Nov 12, 2018 at 22:05
  • $\begingroup$ @BruceET It is entirely relative to others in the group. Within a group of 20 it could range from a maximum of all 10 to 0 (depending on whether a significant gap opened up. $\endgroup$ Commented Nov 12, 2018 at 22:15

1 Answer 1

2
$\begingroup$

Comment: I have a problem grasping the usefulness of a criterion based on the maximum gap.

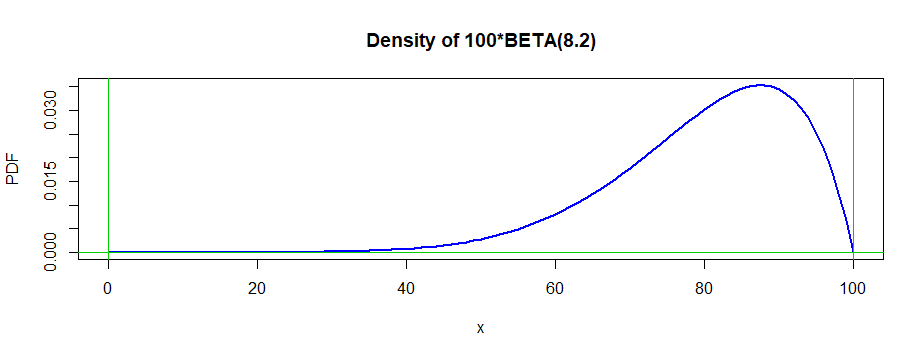
Perhaps the usual distribution of scores would have something like the following density function with support $(0,100),$ based on a multiple of the distribution $\mathsf{Beta}(8,2)$ with mean $\mu = 80$ and median $\eta = 82.$

curve(.01*dbeta(.01*x, 8, 2), 0, 100, lwd=2, col="blue", ylab="PDF",
    main="Density of 100*BETA(8,2)")
  abline(h=0, col="green3");  abline(v=c(0,100), col="green3")
enter image description here

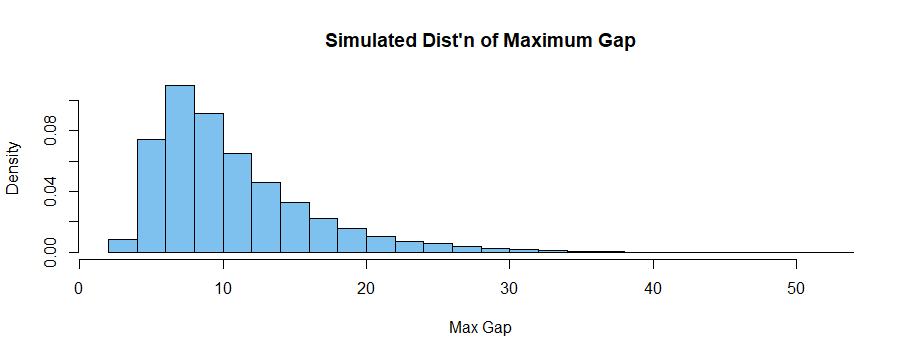
Then one can simulate the size of the average gap (which will usually lie among the lower values) among $n = 20$ observations from this distribution. In the average 6-month scoring, there will be a maximum gap of about 11, and about 52% of the time there will be a largest gap of at least 9.

md = replicate(10^5, max(diff(sort(rbeta(20,8,2)*100))) )
mean(md)
[1] 10.66218
mean(md > 9)
[1] 0.51689
enter image description here

Thus it seems that a fairly normal state of affairs would be to fire employees. Obviously, 10 of 20 employees will be in the lower half (below about 82) at each scoring, and about half of the time some will happen to be below a sizable gap.

If your actual distribution is skewed in this way, I don't see how the sample standard deviation will help you pick the employees below a 'significant' gap.

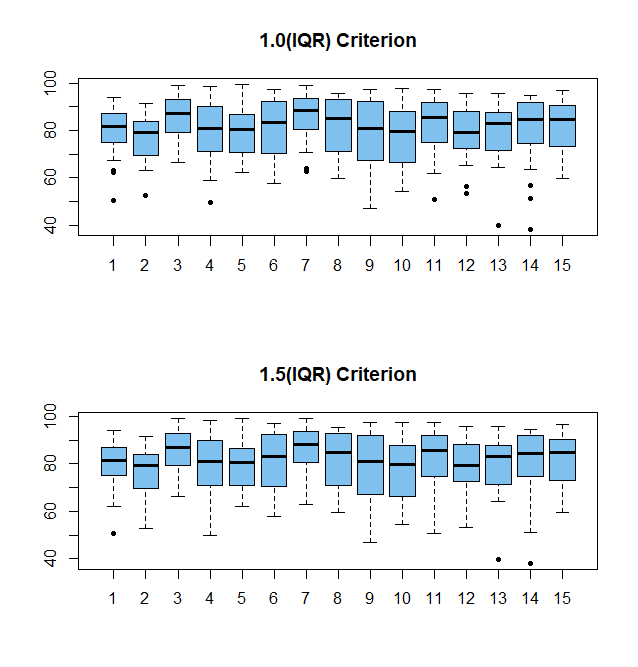
Addendum. To give an idea how boxplot outliers would work, here are boxplots for 15 groups of 20 employees each. I assume the same beta-based distribution as above. A common outlier criterion is that an 'outlier' is a value less than 1.5(IQR) below $Q_1$ or more than 1.5(IQR) above $Q_3,$ where $Q_1, Q_3$ are the lower and upper sample quartiles and IQR = $Q_3-Q_1.$ As an experiment, I altered this rule to be somewhat more aggressive in designating outliers, using IQR instead of 1.5(IQR), that is controlled by the range parameter in R's boxplot function. Because of the skewness of the population distribution high outliers are extremely rare.

# Code for top panel
set.seed(2011);  gp = as.factor(rep(1:15, each=20));  n = 20
x = 100*rbeta(300, 8, 2)
boxplot(x ~ gp, range=1, col="skyblue2", pch=20)
enter image description here

(Top) About half of the 15 boxplots show at least one outlier. Different runs with different simulated data according to the same distribution (different set.seed statement) had as many as 10 groups with outliers. (Bottom) With the same data, only three groups showed outliers (one outlier in each group), according to the 1.5(IQR) criterion.

$\endgroup$
2
  • $\begingroup$ Thanks for the answer. I considered the criterion based on the maximum gap because the employees will actually score one another through a monthly 5 star rating style review which I'm hoping will keep the gap within certain parameters with the exception of truly bad performers. This all assumes reviews are not based on personality clashes and employees do not adopt tactical voting. Still perhaps calculating boxplot low outliers as you suggested might be a better approach ? $\endgroup$ Commented Nov 12, 2018 at 23:51
  • $\begingroup$ See Addendum to my Answer. $\endgroup$
    – BruceET
    Commented Nov 13, 2018 at 0:24

Your Answer

By clicking “Post Your Answer”, you agree to our terms of service and acknowledge you have read our privacy policy.

Not the answer you're looking for? Browse other questions tagged or ask your own question.