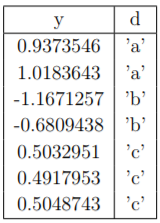
Given this data, I need to create a one way ANOVA table, but I can not use lm, aov, or anova functions. How can I create the table in r without using those functions?
-
2$\begingroup$ Find a ANOVA textbook published before 1970, then you will find it is easy to creat a ANOVA table using just 7 numbers $\endgroup$– user158565Commented Dec 2, 2018 at 5:20
2 Answers
If you are not going to use the lm or anova function, all the values of ANOVA should be computed using basic mathematics. I have tried to recreate the one-way ANOVA as we get from anova function.
Your data as it is:
dta <- data.frame(
  d = rep(c('a', 'b', 'c'), c(2, 2, 3)),
  y = c(0.937, 1.018, -1.167, -0.681, 0.503, 0.492, 0.505)
)
I splitted them into a list, it became easier for me to work later.
lst <- with(dta, split(y, d))
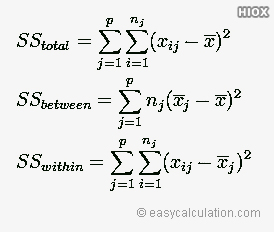
All the means and standard deviations are calculated. $$ \begin{aligned} \text{Grand Mean: } \bar{\bar{x}} &= \sum_{i=1}^a{\sum_{j=1}^{n_i}}x_{ij} \\ \text{Group Mean: } \bar{x}_{i} &= \frac{1}{n_i}\sum_{j=1}^{n_i}{x_{ij}} \\ \text{Group Standard Deviation: } S_{x_i} &= \sqrt{\frac{1}{n_i-1}\sum_{j=1}^{n_i}{(x_{ij} - \bar{x}_i)^2}} \end{aligned} $$
grand_mean <- mean(unlist(lst))
group_mean <- sapply(lst, mean)
group_sd <- sapply(lst, sd)
n <- sapply(lst, length)
Here is the sum of squares. As MSE is just a pooled variance, i have used that fact to compute Error Sum of the square. You can calculate the remaining as,
Total_SS <- sum((unlist(lst) - grand_mean)^2)
Error_SS <- sum(((n - 1) * group_sd^2))
Group_SS <- Total_SS - Error_SS
The Degree of freedom for group, error and total:
Total_df <- length(unlist(lst)) - 1
Error_df <- length(unlist(lst)) - length(n)
Group_df <- Total_df - Error_df
Means of Sum of Squares:
MS_Error <- Error_SS/Error_df
MS_Group <- Group_SS/Group_df
Test Statistic (F) and corresponding P-values:
F_value <- MS_Group / MS_Error
p_value <- pf(F_value, Group_df, Error_df, lower.tail = FALSE)
Bind them together in a matrix for ANOVA table:
anova <- matrix(
  c(Group_df, Error_df, Total_df,
  Group_SS, Error_SS, Total_SS,
  MS_Group, MS_Error, NA,
  F_value, NA, NA,
  p_value, NA, NA),
  ncol = 5)
dimnames(anova) <- list(
  "Group" = c("Between", "Within", "Total"),
  "ANOVA" = c("Df", "Sum_Sq", "Mean_Sq", "F_value", "P_value")
)
Printing the table nicely,
printCoefmat(anova, signif.stars = TRUE, has.Pvalue = TRUE,
             digits = 3, na.print = "")
The Final Output:
            Df Sum_Sq Mean_Sq F_value P_value
Between 2.0000 3.9996  1.9998    65.8 0.00087 ***
Within  4.0000 0.1215  0.0304
Total   6.0000 4.1211
---
Signif. codes:  0 ‘***’ 0.001 ‘**’ 0.01 ‘*’ 0.05 ‘.’ 0.1 ‘ ’ 1
To make an ANOVA table you need the total sums of squares, the treatment(or between) sums of squares, the error (or within) sums of squares, and the correct degrees of freedom for each one. Sometimes they have a column called mean sums of squares, which is just the appropriate sums of squares divided by the corresponding degrees of freedom. It'll look something like this.
Here is a previous answer where i wrote out step by step how to calculate all that if you want. More importantly, in that answer i linked to a Khan Academy video that visually demonstrated it by hand. I'll link it here again.


