2
$\begingroup$

I have a question about statistics theory.

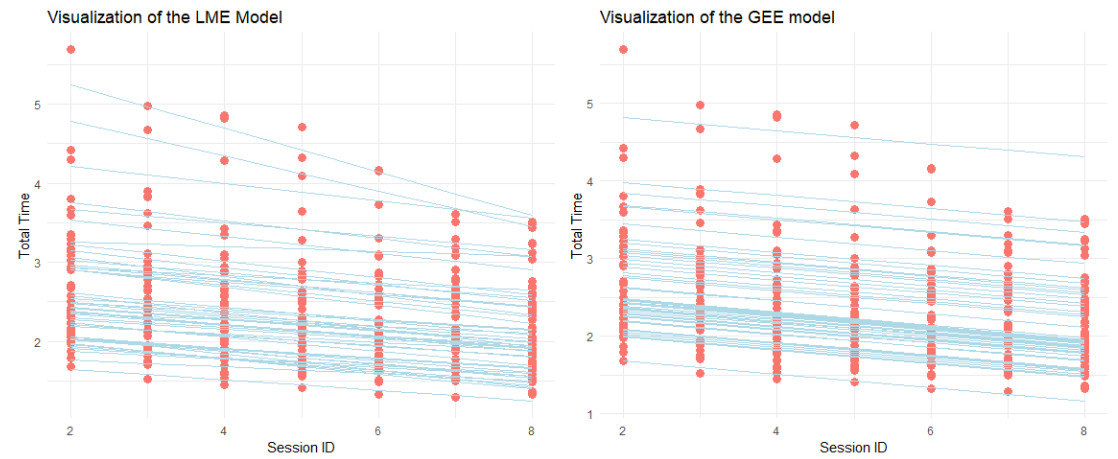
I have longitudinal, repeated measures data where the response variable is skewed right. Using R, I ran a linear mixed-effects model (good for longitudinal, repeated measures data that is normally distributed). I obtained an MSE of 0.034. I then ran the same data using generalized estimating equations (good for longitudinal, repeated measures data and does not assume normal distribution). I obtained an MSE of 0.094. The GEE model seems more appropriate for my data because it does not assume normal distribution but results in a higher MSE than LME which does assume normal distribution.

Can we say that LME is overfitting the data? Is there another possible explanation?

This is how the 2 models visualize:

enter image description here

$\endgroup$
4
  • 1
    $\begingroup$ The distribution of your response variable is not what you should look at. What is important is the distribution conditional on the predictors, i.e., the distribution of the residuals. $\endgroup$
    – Roland
    Commented Dec 4, 2018 at 7:07
  • $\begingroup$ Thanks Roland, I know how to plot residual in lme. Can you direct me to how to plot residuals for gee? Also, how can I summarize the differences between the 2 above plots? $\endgroup$
    – wisamb
    Commented Dec 4, 2018 at 7:15
  • $\begingroup$ For the lme, @Roland is right that the conditional distribution of the response variable given the predictors AND the random effects included in the model should be normal. Before you switch to GEE, you should plot the lme model residuals versus SessionID - their variability will likely be non-constant as the sessions progress. You could address that by either transforming your response (log-transformation) or working with the original response but allowing the error variance to change with SessionID. $\endgroup$ Commented Dec 4, 2018 at 15:21
  • $\begingroup$ Thank you for the response Isabella. That will help me a lot with the visualization. Also, can I make the statement, "LME is overfitting the data"? Why is LME producing a smaller MSE if GEE is a more appropriate model? $\endgroup$
    – wisamb
    Commented Dec 4, 2018 at 19:11

2 Answers 2

5
$\begingroup$

A couple of points:

  • The estimating equation for the fixed-effects coefficients $\beta$ is the same under a GEE and under a linear mixed model. In a sense, the idea behind the GEEs is to adapt the score equation from a mixed model to work for categorical responses borrowing ideas from GLMs. The difference between the two approaches is on how the covariance matrix of the multivariate outcome is estimated. In the linear mixed model you use (restricted) maximum likelihood, whereas in the GEE you use a method of moments estimator based on the residuals, coupled with a working assumption for the correlations that is corrected for misspecification using the sandwich estimator.
  • Hence, even though strictly speaking you don't assume any distribution in GEEs, you see that in your specific case the difference lies in the assumption that you make for the variance-covariance matrix of your outcome. That is, in general, the GEE approach aims to protect you against misspecification of the covariance structure. However, this is not "free-of-charge," you pay for it in terms of power. Namely, if your assumed covariance structure under the mixed model is correct, then the mixed model is more efficient than the GEE.
  • Another relevant and important point is about missing data. The GEE will give you valid inferences if the missing data mechanism is missing completely at random, whereas the linear mixed model under the missing at random mechanism. The latter is more reasonable to hold in practice than the former one.
$\endgroup$
0
1
$\begingroup$

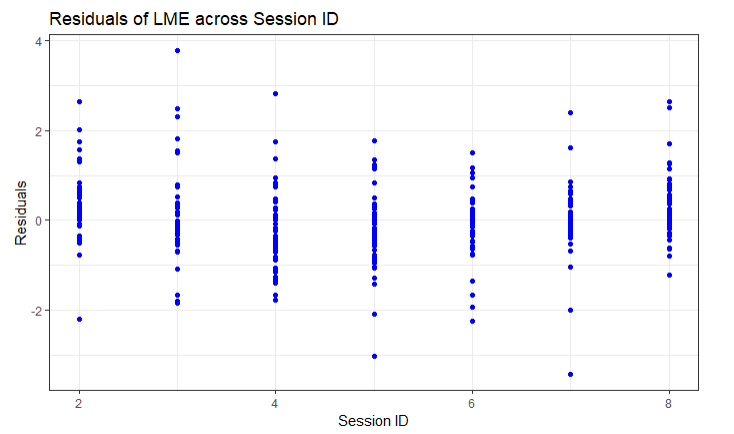
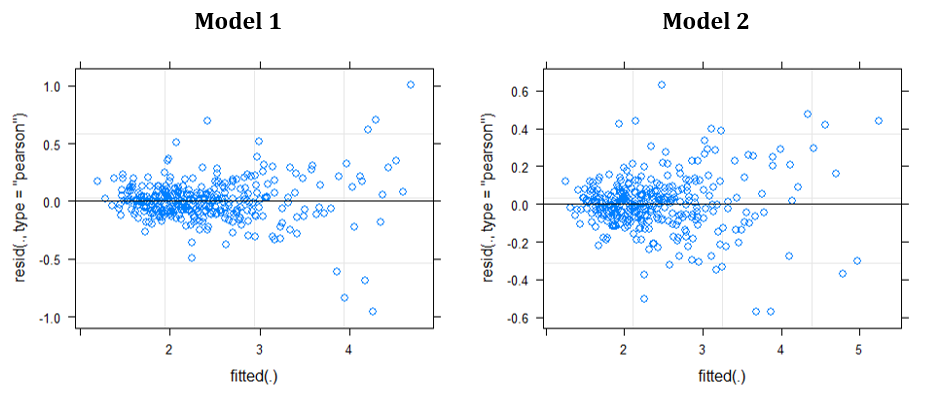
Expanding on the conversation with Roland and Isabella, I plotted residuals of the LME across sessions but I am not seeing a huge difference in variance. I also plotted residuals vs fitted. I had 2 versions of LME: model1 with the term (1 | subject) and model2 with the term (sessionIndex | subject). Model1 shows non-constant variance in this plot and model2 shows constant variance.

Does this mean LME using model2 is good and that's why it has a lower MSE? I am not really understanding it because my reference says LME is for normally distributed response variables. The data I am using does not have a normally distributed response variable so I would expect GEE to be better than LME. Any thoughts?

enter image description here

enter image description here

$\endgroup$

Your Answer

By clicking “Post Your Answer”, you agree to our terms of service and acknowledge you have read our privacy policy.

Not the answer you're looking for? Browse other questions tagged or ask your own question.