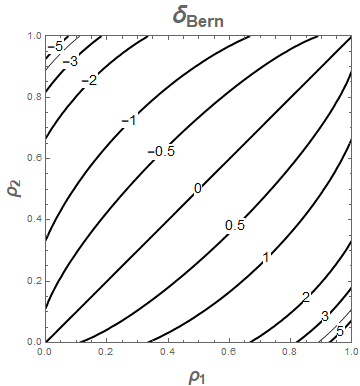
Let $f(x|\rho)$ be the Bernoulli pmf with probability $\rho$ of success. \begin{align} f(x|\rho) = \left\{ \begin{array}{ll} \rho & x = 1 \\ 1-\rho & x=0 \end{array} \right. \end{align}
The problem I'm interested in.
Process $1$ generates successes and failures by randomly sampling from $f(x|\rho_1)$, and process $2$ generates successes and failures by randomly sampling from $f(x|\rho_2)$.
For the sake of concreteness, process 1 consists of a student learning a concept in a particular way, solving a problem that requires them to apply that concept immediately afterward, and either getting it right (resulting in a score $x = 1$) with probability $\rho_1$ or wrong ( resulting in a score $x = 0$) with probability $1-\rho_1$. Process 2 consists of a student learning the same concept in a different way, solving the same application problem, and either getting it right or wrong with probability $\rho_2$ and $1-\rho_2$ respectively.
Now suppose that we separate a class of students into two equal-sized groups with half undergoing the first treatment and half undergoing the second, and the inference problem we care about is of the following flavor:
Given scores $x_{11}, x_{12}, \dots, x_{1n}$ from the students in treatment 1 and scores $x_{21}, x_{22}, \dots, x_{2n}$ from students in treatment 2, define and infer the value of some parameter $\delta$ that can be interpreted as a "standardized difference" in the parameters $\rho_2$ and $\rho_1$.
An analog that suggests a solution.
If instead of being drawn from a Bernoulli distribution, each student's score in treatment 1 were drawn from a normal distribution with mean $\mu_1$ and variance $\sigma_1^2$, and if each student's score in treatment 2 were drawn from a normal distribution with mean $\mu_2$ and variance $\sigma_2^2$, then I would be tempted to define the following parameter as a measure of the ``effect size'' between these two treatments: $$ \delta_\mathrm{norm} = \frac{\mu_1 - \mu_2}{\sqrt{\frac{1}{2}(\sigma_1^2+\sigma_2^2)}} $$ because if I were two then generate samples of size $n$ from both of these treatments, I could use Cohen's $d$, a common effect size statistic which in this case would be: \begin{align} d = \frac{\bar x_2 - \bar x_1}{\sqrt{\frac{(n_1-1)s_1^2 + (n_2-1)s_2^2}{n_1+n_2-2}}} = \frac{\bar x_2 - \bar x_1}{\sqrt{\frac{(n-1)s_1^2 + (n-1)s_2^2}{n+n-2}}} = \frac{\bar x_2 - \bar x_1}{\sqrt{\frac{1}{2}(s_1^2 + s_2^2)}} \end{align} to accurately estimate $\delta$. This gives me confidence that $\delta$ is a parameter that coincides with a commonly used effect size statistic.
Back to the problem of interest.
For the problem of interest, working by analogy, I'm tempted to use the fact that the mean of the Bernoulli pmf is $\rho$ and its variance is $\rho(1-\rho)$ to define the following effect size parameter in the case of student scores drawn from Bernoulli: \begin{align} \delta_\mathrm{Bern} = \frac{\rho_2 - \rho_1}{\sqrt{\frac{1}{2}\big(\rho_1(1-\rho_1) + \rho_2(1-\rho_2)\big)}} \end{align} and this could be estimated by plugging in $\hat \rho_1$ and $\hat \rho_2$, the experimentally observed proportion of successes for each group of students, for $\rho_1$ and $\rho_1$.
However, I haven't encountered this solution to the problem at hand anywhere in the statistics literature. It's appealing to me because it has a nice interpretation: it's the difference in successes of each of the two groups normalized by a number that represents a kind of weighted combination of the variations one would expect if a student were to take a test with many questions, each having a probability $\rho_1$ or $\rho_2$ of being answered correctly depending on the treatment.
Questions.
Is the parameter $\delta_\mathrm{Bern}$ I've defined above commonly used as an effect size parameter for this sort of problem? Is there a more commonly-used and/or better way to attack this? Will I confuse practitioners if I use an estimate of $\delta_\mathrm{Bern}$ to compute effect size in such an experiment?

