0
$\begingroup$

I want to determine correlation between two variables. Let say we have restaurant, and during a day they make from 1 - 6 pizza per day. We collected data and now we want to determine if there is correlation between time of first pizza and number of pizza for that day. Possible appliance, if first order is received early in the morning we can expect higher numbers of order that day (fixed working hours). Data are:

day | number of pizza | time of first pizza

1/ 1 / 09:45

2/ 2 / 09:20

3/ 5 / 08:23

4/ 3 / 08:30

and so on... Is it possible this kind of analysis on what will be most appropriate method.


enter image description here

$\endgroup$

1 Answer 1

1
$\begingroup$

This can be done easily with a linear regression model. Your dependent variable is number of pizza, your independent variable is time of first pizza (transform it into a numerical variable). The linear model will return the intercept and slope, which you can use to estimate how many pizzas you can expect at any given time, additionally the slope will tell you whether you can expect more pizzas depending on the time of first order.

$\endgroup$
4
  • $\begingroup$ Should I transform 24 h in to minutes ( 625 minutes) or from begging of work day (starting from 08:00 / 105 minutes)? $\endgroup$
    – explorer
    Commented Dec 20, 2018 at 11:16
  • $\begingroup$ @explorer It really doesn't matter to the model, whatever is easier to you for interpretation. Personally I would start from 8:00. $\endgroup$ Commented Dec 20, 2018 at 11:20
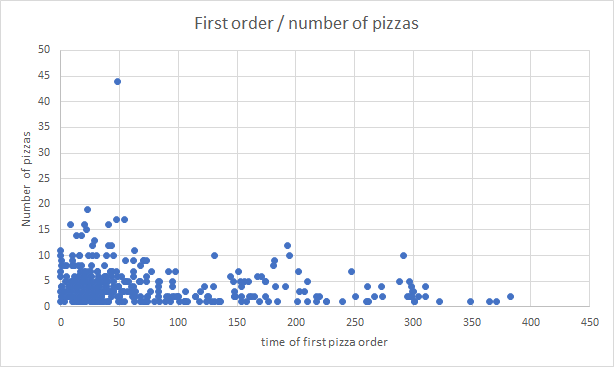
  • $\begingroup$ I just add graph that shows relation between time of first pizza and number of pizza. I believe that there is small dependencies, I would like to hear your comment. thx $\endgroup$
    – explorer
    Commented Jan 8, 2019 at 8:41
  • $\begingroup$ @explorer If this is going to be a new topic then you should ask a new question. Anyway, what do you mean by dependence? If the time of first pizza order is higher you will on average have less pizzas on that day? You will get this result from the linear model, whether there is a significant difference (p-value). I can't really tell from this graph whether that's true. $\endgroup$ Commented Jan 8, 2019 at 9:04

Your Answer

By clicking “Post Your Answer”, you agree to our terms of service and acknowledge you have read our privacy policy.

Not the answer you're looking for? Browse other questions tagged or ask your own question.