3
$\begingroup$

In my test procedure I sequentially take 10 measurements of a recently perturbed physical system, and I often find the first few (between 0 and 4) measurements can be inaccurate because the system has not settled/equilibrated. The initial non-equilibrated measurements may just have less accuracy or show a distinct trend, while the remainder should not have a trend and just show random variation.

I am currently eyeballing the data to discard any initial poor data but want to have a more rigourous and automated method for selecting the "good" data. I am aware (eg here) of various outlier tests (Chauvenet, Grubbs, Pierce, Generalized ESD) but because of "masking" and trending don't think they will give reliable results. The experimental conditions are fairly well controlled so there are unlikely to be other genuinely sporadic outliers appearing.

Is there a more appropriate statistical test (than say Generalised ESD) for my procedure?

Update:

To give some more details I have run about 15 procedures so far and while some datasets have all good values most need 2 or 3 measurements dropped, so it seems reasonable to query the first 4.

The problem description above is somewhat simplified in that more than one number is determined for each measurement, ie there are several system parameters measured. Only 1 or 2 parameters show non-equilibrium effects though so there is limited scope for cross-checking.

The aim is to get reliable values for parameters of an unchanging system and therefore the model I am trying to fit is a series of constant values with some measurement error. The measuring is time-consuming but automated and can currently run overnight, the analysis is performed afterwards. It is possible to increase the number of measurements but this obviously takes more time.

From the previous results I have a good idea of the expected variation in measurements at equilibrium, so I could use that information in addition to the within-dataset variation to assess outliers. Currently I only use that information to determine if the final error is acceptable.

Six good data-points is sufficient to get an adequate estimate of the parameters and to detect any obvious problems with the process, so just dropping the first 4 is an acceptable solution. It seems from the discussion this is the best solution, unless the Dixon's test variant can be used. Where can I read more about that?

$\endgroup$
2
  • $\begingroup$ What, if anything, is common to each of the 15 or so runs? E.g., are they all measuring the same system? If not, are there some parameters you expect to remain the same between runs? I think it might be possible to "borrow strength" for outlier detection by suitably combining all data into one dataset, rather than viewing it as 15 separate datasets, and thereby overcome the pessimistic views expressed in comments elsewhere in this thread. $\endgroup$
    – whuber
    Commented Oct 15, 2012 at 16:23
  • 1
    $\begingroup$ They are different systems. Although they are similar they all differ significantly and I can't assume any parameters are the same between them. $\endgroup$ Commented Oct 17, 2012 at 10:37

2 Answers 2

3
$\begingroup$

I don't necessarily see this as being easily treated as a time series problem. To comment on the way you detect outliers, Pierce and Chauvenet are flawed procedures that should be discussed only for historical purposes and never used. Outlier detection involves more than just knowning what the variance should be, the underlying population distribution needs to be assumed. Dixon's test and Grubbs' test assume normality and are desined for single outliers. In their original form they can be very sensitive to masking. But Dixon has variants that enable you to detect multiple outliers as long as the number of outliers is small. Also as I have mentioned in other post Dixon's test is robust to departures from normality. In your case 10 is small enough but I worry about trying to detect as many as four out of a sample of only 10. There is a little bit of a time dependence with you knowing why the outliers are likely to be among the first few measurements. But as Bill Huber pointed out in comments the sequence of 10 is too short to do any sophisticated time series modelling.

Normally I argue that outliers should not be rejected but studied further. Here you seem to have a physical reason for higher variability and or trends with the early measurements. CUSUM charts are good for detecting trends but the sequence may be too short to do much. It may be that something informal such as dropping the first four out of ten will work as a practical matter even though it is not a formal statistical test.

$\endgroup$
9
  • 1
    $\begingroup$ If it is time series data then it is a time series opportunity ....But that's just my opinion. Since I own a hammer , everything looks like a nail ! $\endgroup$
    – IrishStat
    Commented Oct 1, 2012 at 19:57
  • $\begingroup$ @IrishStat I will give you that but do you concede that the series may be too short for time series analysis to work very well? $\endgroup$ Commented Oct 1, 2012 at 19:58
  • $\begingroup$ @MichaelChernick: I, too, wonder if he shouldn't just drop the first four measurements all the time. Obviously, if things "settled down" after two measurements for a particular test, he'd be throwing away 25% of his real data, but trying to fit a model to 10 points (of which up to 40% are outliers) seems impossible. Perhaps he needs to expand and formalize how it is he decides "by eye" what's "settled down" and what's not. $\endgroup$
    – Wayne
    Commented Oct 1, 2012 at 20:18
  • $\begingroup$ @michael No I don't concede that. If you have two points 5 and 10 and the next point is 20, I am willing to question the "20". If i have three points 5,10,15 , I have mo problem. Time series methods are the answer to a maiden's prayer regarding the "general term" i.e. given a sequence , how to generalize (forecast ) the sequence. Intervention DEtection is simply a ploy to separate the regular (values descibable by the general term) and thos that are not. To suggest that one throw away 4 of the first 10 is to me a minor blasphemy ( jsu kidding ! ). $\endgroup$
    – IrishStat
    Commented Oct 1, 2012 at 20:45
  • $\begingroup$ @IrishStat It is not the first ten it is the only 10! Both of you examples indicate a linear trend. The second has some noise (maybe) while the first does not. But a trend is a problem for him. It may have a trend or it may have a high variance before it stablizes. All those points are suspect according to the OP. This is a problem that defies statistical analysis because the sample size is far too small to detect one or both of these anomalies and identify the point of stability. A good physical model with time series analysis might work if there were just a little more data available. $\endgroup$ Commented Oct 1, 2012 at 21:09
0
$\begingroup$

Detecting trends is similar to detecting step/level shifts insofar as a step is a difference of atrend just as a pulse is the difference of a step/level. Intervention Detection ala Tsay and others has been extended by SAS and AUTOBOX ( a piece of software that I am involved with commercially ) to emoiricallyt identify local time trends. I suggest that you contact both SAS and AUTOBOX and send them your data and have them analyse it (automatically ) and send you back the results. Maybe you can like Yogi said "learn a lot by simply watching !" Hope this helps.

EDIT:

Pulse outliers are often be mis-dagnosed as variance changes. They are 1 period variance changes. THe procedures I refer to are appropriate for single series not parallel series. Pure variance change can be detected by conducting a variance difference F test "before and after" some time point BUT this premises no anomilies .This optimal breakpoint can be found by a simple search procedure. The idea of detecting 4 kinds of Interventions is as follows:

Pulse interventions (PI) temporarily affect the series at 1 point in time 0,0,0,0,0,0,0,0,0,0,0,0,0,0,0,0,0,0,1,0,0,0,0,0,0,0,0,…..t

Step/Level interventions permanently (SLI) shift the baseline (implied intercept) of the series. e.g. 0,0,0,0,0,0,0,0,0,0,0,0,0,0,0,0,0,0,1,1,1,1,1,1,1,1,1,…..t

Seasonal Pulse interventions (SPI) permanently affect the series at all subsequent seasonal points in time much like seasonal fixed effects. e.g. 0,0,0,0,0,0,0,0,1,0,0,0,1,0,0,0,1,0,0,0,1,0,0,0,1,0,0,0,…..t

Local Time Trend (LTT) interventions permanently change the slope of the series reflecting steady state change from that point forward. e.g. 0,0,0,0,0,0,0,0,0,0,0,0,0,0,0,0,0,0,1,2,3,4,5,6,7,8,9,…..t

note that LTT = STEP/(1-B) or STEP = (1-B)LTT

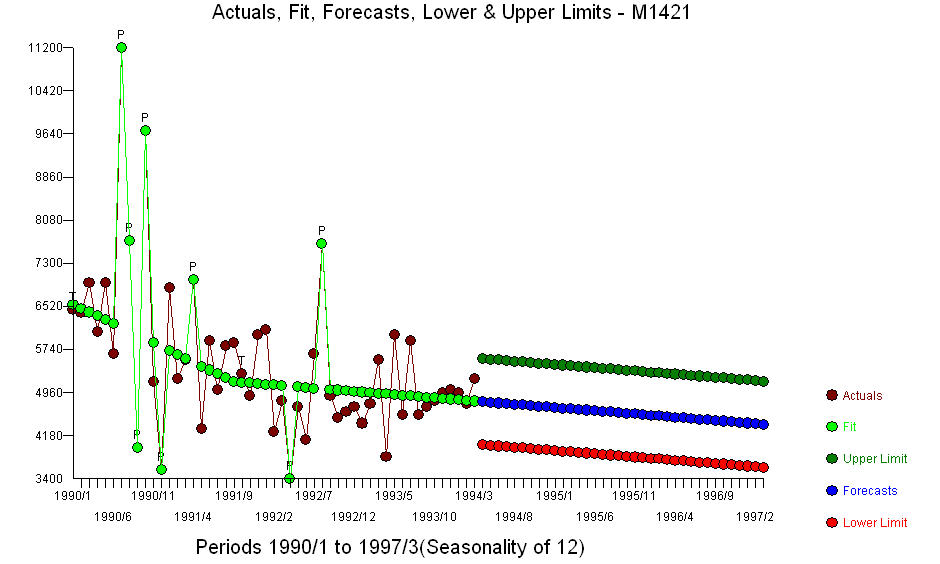
As an example of a time series with LTT's consider an example (nob=51). Modelling 10 numbers would be more difficult.

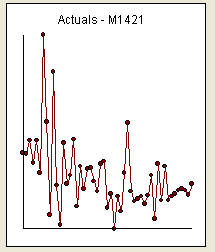
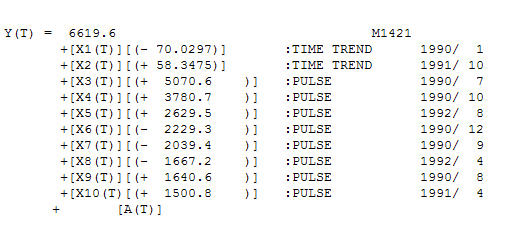
the data enter image description here the plot enter image description here the equation enter image description here ( thus two time trends ) enter image description here

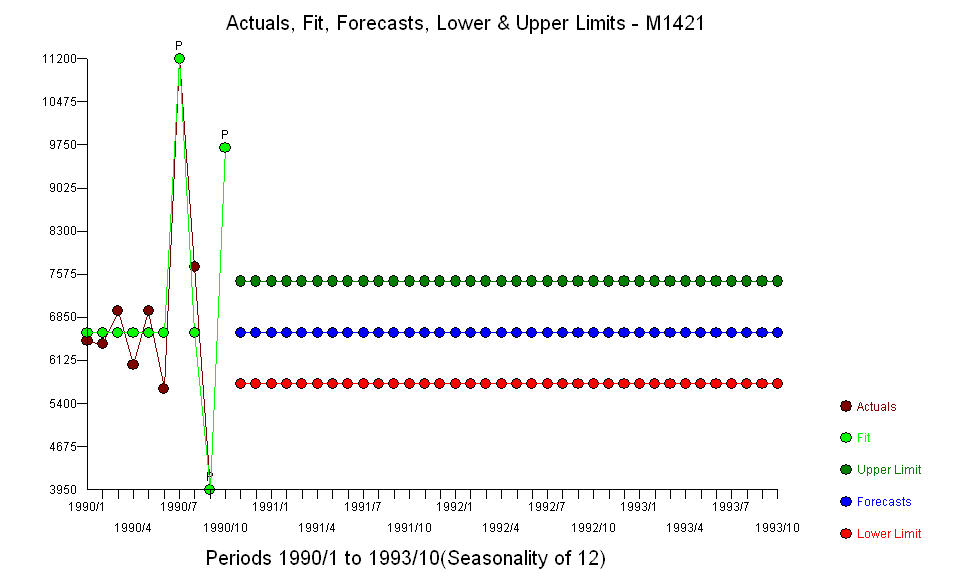
If i took the first 10 values this is waht was resolved enter image description here . Three values were ear-marked as not being represntative.

$\endgroup$
3
  • $\begingroup$ Could you be a little more specific about how you will (a) detect level shifts in such short sequences, (b) exploit the presumption that this is not a level shift but rather a change in variance, (c) exploit the presumption that the variance will initially decrease and then level off, and (d) capitalize on having data from many parallel test procedures. (I haven't seen any examples so far of Autobox or SAS handling any of these special characteristics of the problem, and all of them provide powerful opportunities for better procedures than usually found in time series software.) $\endgroup$
    – whuber
    Commented Oct 1, 2012 at 17:18
  • $\begingroup$ @whuber With 10 values as above , one would want to apply the least disruptive remedy. Theree is no doubtthat one could argue that there has been an increase in variance at period 8. The consequences of such a hypothesis going forward could have downsize effects. Untreated pulses I.E. changes in the mean of the errors can be mis-diagnosed as changes in the level, changes in parameters, changes in variance or more simply and less drastic ...just simply unusual i.e. pulses. As more observations become available it will become clearer as to the most probable cause of the exceptional activity. $\endgroup$
    – IrishStat
    Commented Oct 15, 2012 at 16:18
  • $\begingroup$ @whuber The detection of a level shift is accomplishe by Intervention Detection (note this is not the same as Interevntion Modeling) Essentially it is sequence of trial baloons taht are evaluated based upon the effeciveness of the candidate structure. The best way to understand this is to see Tsay unc.edu/~jbhill/tsay.pdf. $\endgroup$
    – IrishStat
    Commented Oct 15, 2012 at 17:37

Your Answer

By clicking “Post Your Answer”, you agree to our terms of service and acknowledge you have read our privacy policy.

Not the answer you're looking for? Browse other questions tagged or ask your own question.