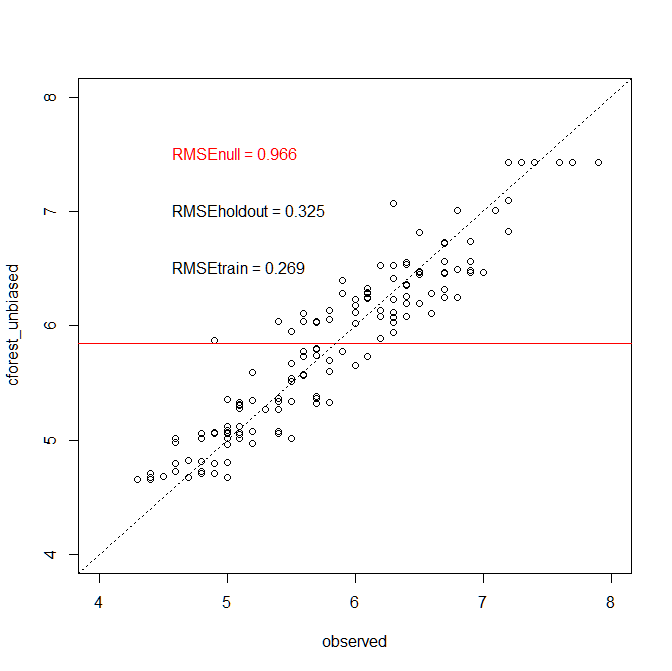
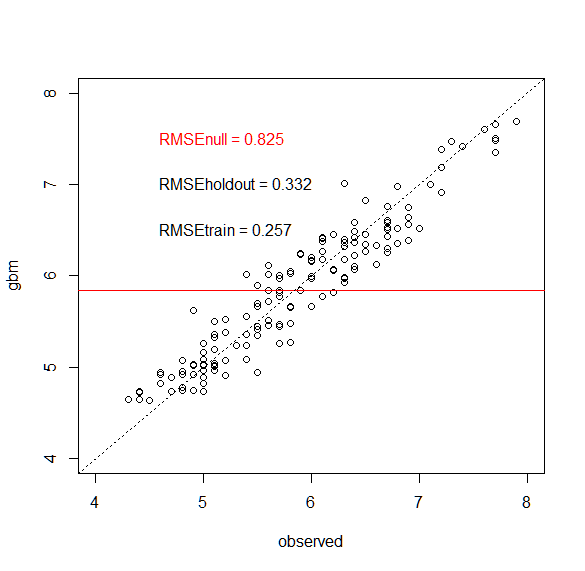
I'm using machine learning methods in R for descriptive regression modelling of a small dataset. I have fit random forest (randomForest), unbiased random forest (cforest) and boosted regression trees (gbm) using caret with 10 fold cross-validation and 5 repeats.
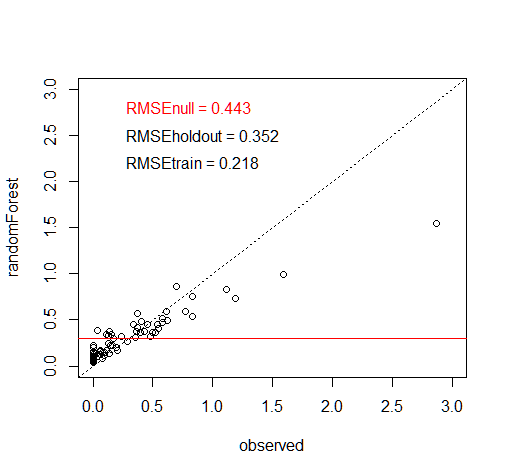
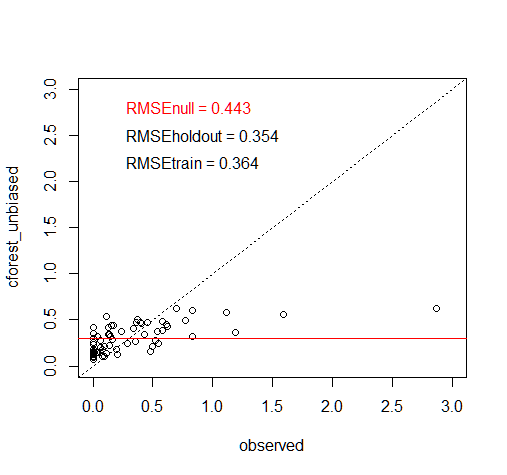
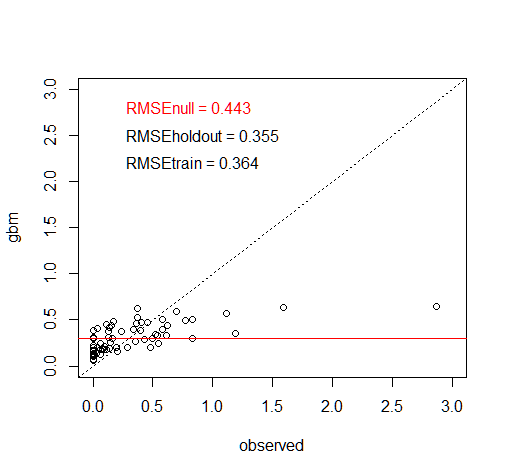
I've tuned the hyperparameters for each model and achieved the same cross-validation RMSE accuracy. However, only the random forest model gives a satisfactory fit for the training data. Below are the calibration plots and fit stats (the red, horizontal line in each is the observed mean corresponding to the null RMSE).
I have used predict() on the caret models and am confident that these are predictions are for the training set. Predictor variable importance statistics and partial dependence plots are qualitatively similar for all three models (except that cforest does more to reduce bias). So, while these three models detected similar patterns in the data, how come two of the three fit poorly to the training data?
My choice was random forest, but I haven't found an effective method for correcting for bias in the importance statistics for that model.
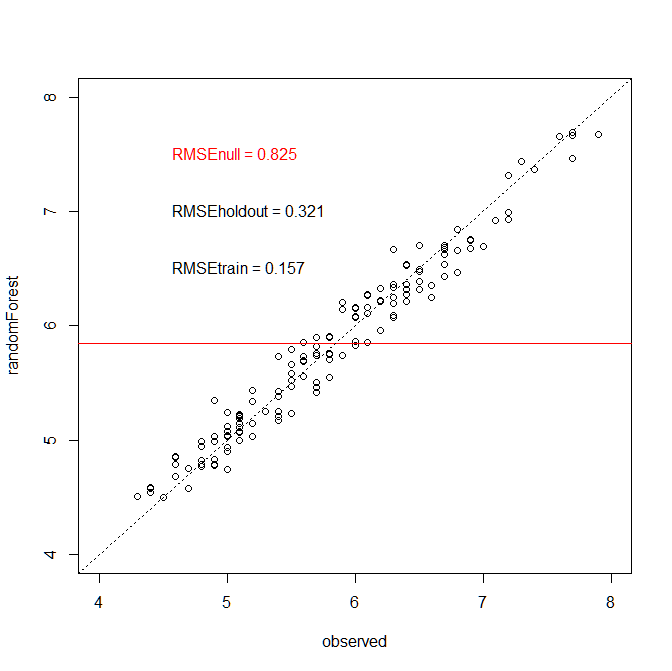
UPDATE: The following code and plots provide examples using the iris dataset. Note that, like my data above, randomForest RMSEtrain is consistently c. 0.6 times RMSEtrain for cforest and gbm models. I think randomForest is overfitting and therefore comparing calibration plots and RMSEtrain among different models is misleading?
    data(iris)

    ## models without added noise

    # null model
    RMSEnull <- sqrt(mean((iris[, 1] - mean(iris[, 1]))^2))

    # random forest
    set.seed(69)
    mygrid <- data.frame(mtry=c(1, 2, 3))
    mycontrol <- trainControl(method="repeatedcv", number=5,
                      repeats=5)
    mymod.rf <- train(x=iris[, 2:4], y=iris[, 1], method="rf",
                    trControl=mycontrol, tuneGrid=mygrid)
    round(head(mymod.rf$results[order(mymod.rf$results$RMSE), ]), 3)
RMSEholdout <- mymod.rf$results[order(mymod.rf$results$RMSE), ]
    RMSEholdout <- RMSEholdout[1, 2]
    RMSEtrain <- sqrt(mean((iris[, 1] - predict(mymod.rf))^2))
    plot(iris[,1], predict(mymod.rf), xlim=c(4,8), ylim=c(4,8),
           xlab="observed", ylab="randomForest")
    abline(h=mean(iris[,1]), col="red")
    abline(0,1, lty="dotted")
    text(4.5, 7.5, paste("RMSEnull =", round(RMSEnull, 3)),
             pos=4, col="red")
    text(4.5, 7.0, paste("RMSEholdout =", round(RMSEholdout,3)),
           pos=4)
    text(4.5, 6.5, paste("RMSEtrain =", round(RMSEtrain, 3)),
          pos=4)

    # conditional random forest unbiased
    set.seed(69)
    mygrid <- data.frame(mtry=c(1, 2, 3))
    mycontrol <- trainControl(method="repeatedcv", number=5,
            repeats=5)
    mymod.cf <- train(x=iris[,2:4], y=iris[,1], method="cforest",
                    trControl<-mycontrol, tuneGrid=mygrid)

    round(head(mymod.cf$results[order(mymod.cf$results$RMSE), ]),
3)
RMSEholdout <- mymod.cf$results[order(mymod.cf$results$RMSE),]
    RMSEholdout <- RMSEholdout[1, 2]
    RMSEtrain <-  sqrt(mean((iris[, 1] - predict(mymod.cf))^2))
    plot(iris[,1], predict(mymod.cf), xlim=c(4,8), ylim=c(4,8),
         xlab="observed", ylab="cforest_unbiased")
    abline(h=mean(iris[, 1]), col="red")
    abline(0,1, lty="dotted")
    text(4.5, 7.5, paste("RMSEnull =", round(RMSEnull, 3)),
          pos=4, col="red")
    text(4.5, 7.0, paste("RMSEholdout =", round(RMSEholdout,3)),
          pos=4)
    text(4.5, 6.5, paste("RMSEtrain =", round(RMSEtrain, 3)),
         pos=4)

    # boosted regression tree
    set.seed(69)
    mygrid <- expand.grid(shrinkage=0.01, interaction.depth=c(1,
            2), n.minobsinnode=c(5, 10, 20),
             n.trees=seq(100, 2000, 100))
    mycontrol <- trainControl(method="repeatedcv", number=5,
               repeats=5)
    mymod.gbm <- train(x=iris[, 2:4], y=iris[, 1], method="gbm",
               trControl=mycontrol, tuneGrid=mygrid, verbose = F)
    round(head(mymod.gbm$results[order(mymod.gbm$results$RMSE),
              ]), 3)
RMSEholdout <-
  mymod.gbm$results[order(mymod.gbm$results$RMSE), ]
    RMSEholdout <- RMSEholdout[1, 5]
    RMSEtrain <- sqrt(mean((iris[, 1] - predict(mymod.gbm))^2))
    plot(iris[, 1], predict(mymod.gbm), xlim=c(4,8), ylim=c(4, 8),
           xlab="observed", ylab="gbm")
    abline(h=mean(iris[,1]), col="red")
    abline(0,1, lty="dotted")
    text(4.5, 7.5, paste("RMSEnull =", round(RMSEnull, 3)),
         pos=4, col="red")
    text(4.5, 7.0, paste("RMSEholdout =", round(RMSEholdout,3)),
            pos=4)
    text(4.5, 6.5, paste("RMSEtrain =", round(RMSEtrain, 3)),
         pos=4)

    ## models with added noise
    # this should do
    plot(iris[,1], iris[,1]+rnorm(dim(iris)[1], 0, 0.4))
    noisyiris <- [, 1] + rnorm(dim(iris)[1], 0, 0.4)

    # and the remaining code is like above,
    #with noisy replacing iris[,1]
    # I'm not going to present the additional three plots

