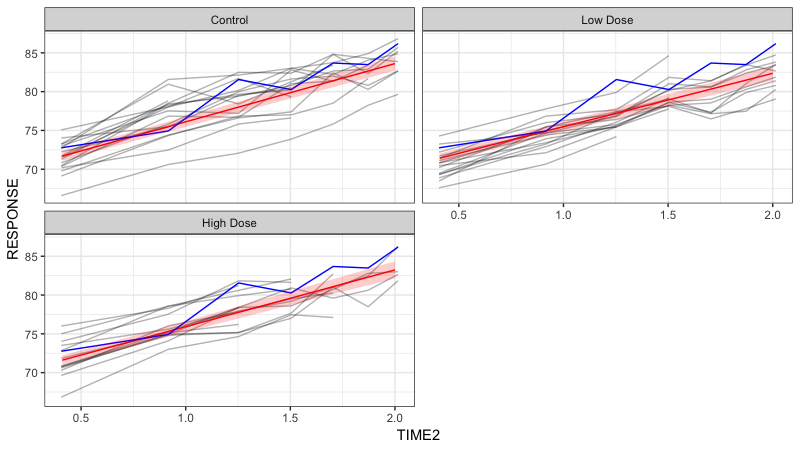
I just started learning about linear mixed models and was curious about using a linear model as a discriminative model. This example comes from Linear Mixed Models for Longitudinal Data - Verbeke.
In this dataset, the results of an experiment on the effect of a testosterone inhibitor on the craniofacial growth is recorded. There were 50 rats in the study where they were randomized to control group, low dose, and high dose group. The model used in the book assumes subject-specific intercepts as well as slopes:
$$ Y_{ij} = (\beta_0 + b_{1i}) + (\beta_1 L_i + \beta_2 H_i + \beta_3 H_i + b_{2i})t_{ij} + \epsilon_{ij}, \quad j = 1,\ldots,n_i $$
Say we have a new rat's response (Show in blue in the graph below) but do not know which group it was in (not very realistic but just to illustrate the question). Can we use a linear mixed model to predict which group it comes from, e.g. use the linear mixed model as discriminative model? Does this extend if we have more than one fixed effect?
I saw there was at least one paper that described it but could not read it behind a paywall:
The code below shows the model for the linear mixed model with predictions shown with the red line and the "new" rat which we want to classify in blue.
library(lme4)
library(ggplot2)
library(effects)

set.seed(13)

rats <- read.csv("rats01.txt",sep="\t")
rats$TIME2 <- log(1+(rats$TIME-45)/10);
rats$SUBJECT <- as.factor(rats$SUBJECT)
rats$GROUP <- as.factor(rats$GROUP)
levels(rats$GROUP) <- c("Control", "Low Dose", "High Dose")

# This model has fixed effects only for the interaction
fit1.lmer <- lmer(RESPONSE ~ TIME2:GROUP + (1 + TIME2|SUBJECT),data=rats)

# Create a new rat which we want to determine which group it is in
fixed_ef <- fixed.effects(fit1.lmer)
time <- seq(50, 110, by = 10)
time2 <- log(1 + (time - 45) / 10)
# Coefficients from low dose group, with some noise.
new_rat <- data.frame(
  RESPONSE = fixed_ef[1] + fixed_ef[2] * time2 + rnorm(length(time2), 0, 2),
  TIME2 = time2
  )

new_rat

ee <- as.data.frame(Effect(c("GROUP", "TIME2"), fit1.lmer))
ggplot() +
  theme_bw() +
  facet_wrap(vars(GROUP), nrow = 2) +
  geom_line(aes(x = TIME2, y = RESPONSE, group = SUBJECT), alpha = 0.3, data = rats) +
  geom_line(aes(x = TIME2, y = fit), color = "red", data = ee) +
  geom_line(aes(x = TIME2, y = RESPONSE), color = "blue", data = new_rat) +
  geom_ribbon(aes(x = TIME2, ymin=lower,ymax=upper),colour=NA,alpha=0.2, fill = "red", data = ee)

