3
$\begingroup$

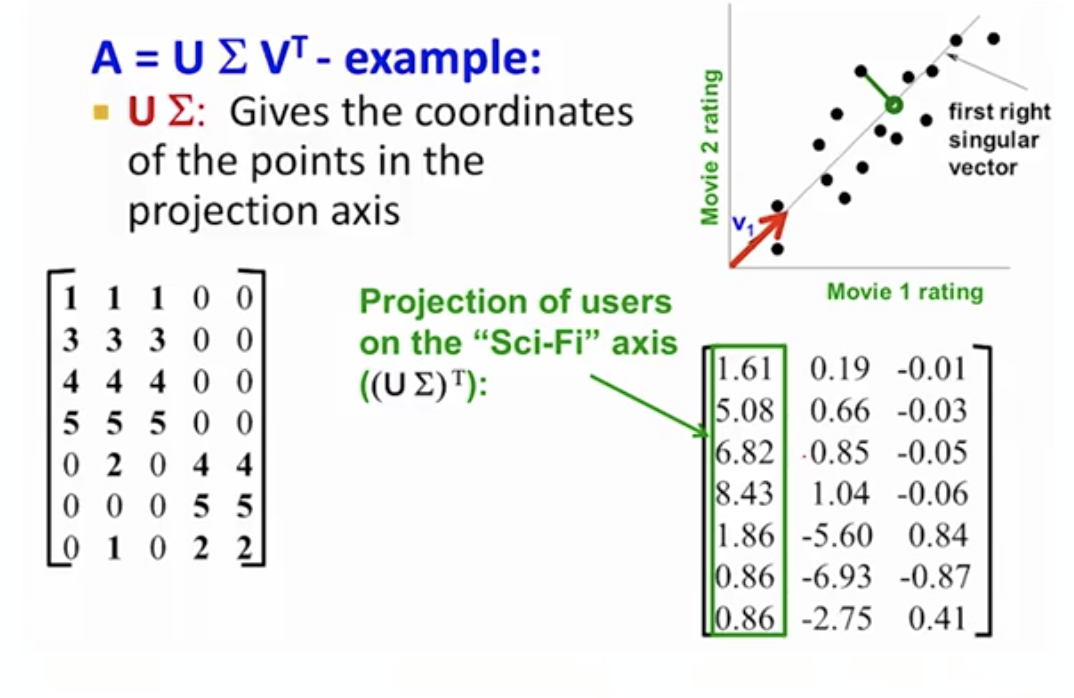
I am watching a YouTube video on SVD, and attempting to recreate some of its examples to better understand the internal machinery of the algorithm. In one of the slides, the instructor mentions that the product of the left singular vectors and the singular values diagonal matrix, $U\Sigma$, will give the coordinates of the points in the projection axis:

enter image description here

I tried to replicate this using Python:

import numpy as np
from scipy.linalg import svd
x = np.linspace(1,20, 20)
x = np.concatenate((x,x))
y = x + np.random.normal(0,1, 40)
A = np.stack([x,y]).T

The 2D features look like this: enter image description here
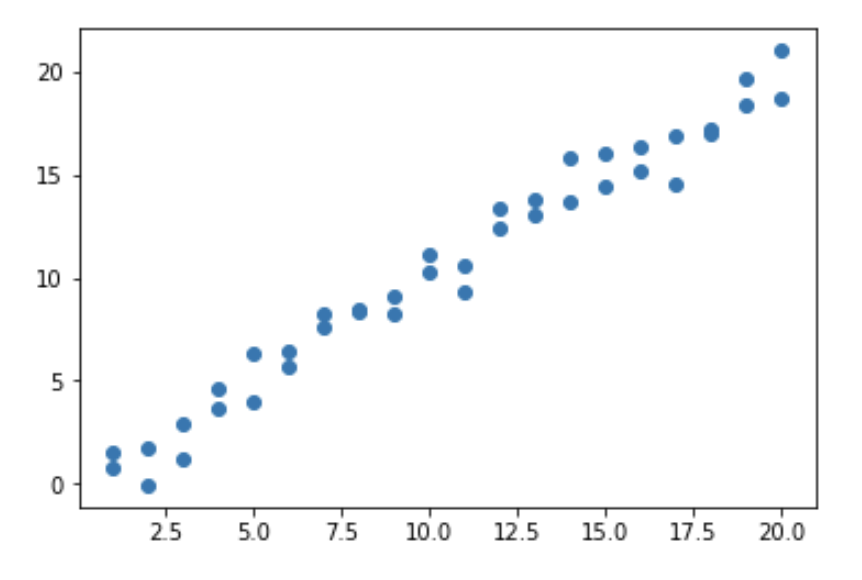
Very straightforward, linear relationship that should be easily encodable into one dimension:

D = 1 # define the number of desired concepts (dimensions)

U, S, V = svd(A)
S = np.diag(S)[:D,:D]
V = V[:D,:]
U = U[:,:D]

#Examine the new points projected:
U.dot(S).T

My output looks like this:

array([[ -1.74863878,  -2.66276714,  -2.98768631,  -5.44595742,
         -8.02886504,  -8.24785679, -10.35313385, -11.60196262,
        -12.80992842, -14.96076055, -15.28834347, -17.26752538,
        -18.9260174 , -21.06596511, -20.7882933 , -22.87015657,
        -23.95399225, -24.78878465, -27.31559524, -29.00987543,
         -1.28269614,  -1.36805834,  -4.15878884,  -6.11100597,
         -6.34365475,  -8.77205121, -10.79641343, -11.57002065,
        -12.20840018, -14.31109098, -14.34744527, -17.97651747,
        -18.40141581, -19.61488063, -21.9849372 , -22.08384878,
        -22.28500687, -24.91212881, -26.42387864, -27.39477121]])

I noticed that in my new projected axis, all of my values are negative. In the example in the YouTube video, it seems like the users with strong sci-fi affinity (the first concept or dimension) have large positive values in the "Sci-Fi" axis. However, users with strong affinity for romance (the second concept or dimension) have very large negative values in the "Romance" axis. My question is - what exactly is the reference point(0) of these new axis?

I notice that in the YouTube video, the only projected values that are close to 0 are the 3rd dimension, which the instruction says does not encode much variance and can thus be discarded. So am I right to interpret this as - it doesn't matter what the sign of the projected values is, but only their absolute value?

$\endgroup$
1

1 Answer 1

2
$\begingroup$

The sign of the scores ($U\Sigma$) and that of the corresponding right singular vectors $V$ are themselves arbitrary. The reason is that singular vectors define a new axis system, the signs of the system define the positive and negative direction on that new system but taken seperately the signs do not mean much. To give a very simple example: if we used "minus one meter" as an imaginary measurement of displacement named imagmeter, the statement: "move 1 imagmeter to the right" would be equivalent of saying "move 1 meter to the left". The sign of the axis system relates to our units' interpretation and vice versa.

Particular to the question/video: I quickly run an SVD using the number in the rating matrix R shown in the YouTube video. Somewhat annoyingly does not reproduce the same exact SVD factorisation but one that is close enough. (Code shown below, I used MATLAB too, I got the same answers.)

In any case, a near-zero value in the projection scores ($U\Sigma$) means that along that axis ($V$) the related concept has a very weak presence in the original sample. For the case of the movie application here, the low projection score $0.19$ in the first row (i.e. first user) of the second column (i.e. second concept - romantic movies) means that the information from romantic movies does not affect the variation pattern in the ratings of the first user. As whuber mentioned, the CV question: Does the sign of scores or of loadings in PCA or FA have a meaning? May I reverse the sign? provides more general answers that can help clarifying this question more generally.

R = matrix( c(1,1,1,0,0,
              3,3,3,0,0,
              4,4,4,0,0,
              5,5,5,0,0,
              0,2,0,4,4,
              0,0,0,5,5,
              0,1,0,2,2), byrow = TRUE, ncol = 5)    
svdR = svd(R)
$d
[1] 1.248101e+01 9.508614e+00 1.345560e+00 3.046427e-16 0.000000e+00

$u
            [,1]        [,2]        [,3]          [,4]       [,5]
[1,] -0.13759913 -0.02361145 -0.01080847  5.601120e-01 -0.3757346
[2,] -0.41279738 -0.07083435 -0.03242542  2.063933e-01  0.7559744
[3,] -0.55039650 -0.09444581 -0.04323389 -7.248090e-01 -0.1846038
[4,] -0.68799563 -0.11805726 -0.05404236  3.439888e-01 -0.2307547
[5,] -0.15277509  0.59110096  0.65365084  2.584979e-16  0.2000000
[6,] -0.07221651  0.73131186 -0.67820922  0.000000e+00  0.0000000
[7,] -0.07638754  0.29555048  0.32682542  1.292489e-16 -0.4000000

$v
            [,1]        [,2]       [,3]          [,4]          [,5]
[1,] -0.56225841 -0.12664138 -0.4096675 -7.071068e-01  0.000000e+00
[2,] -0.59285990  0.02877058  0.8047915  1.110223e-16 -4.877240e-17
[3,] -0.56225841 -0.12664138 -0.4096675  7.071068e-01  4.877240e-17
[4,] -0.09013354  0.69537622 -0.0912571  5.551115e-17 -7.071068e-01
[5,] -0.09013354  0.69537622 -0.0912571  0.000000e+00  7.071068e-01

round( svdR$u %*% diag( svdR$d ) , digits = 1 )[,1:3]
      [,1] [,2] [,3]
[1,] -1.72 -0.22 -0.01
[2,] -5.15 -0.67 -0.04
[3,] -6.87 -0.90 -0.06
[4,] -8.59 -1.12 -0.07
[5,] -1.91  5.62  0.88
[6,] -0.90  6.95 -0.91
[7,] -0.95  2.81  0.44
$\endgroup$

Your Answer

By clicking “Post Your Answer”, you agree to our terms of service and acknowledge you have read our privacy policy.

Not the answer you're looking for? Browse other questions tagged or ask your own question.