3
$\begingroup$

I am interested in the effect of the extend to which an occupation consists of routine codifiable tasks and individual job displacement. I have individual level survey data and use a logistic model to account for the binary nature of the dependent variable. My inital results look like this, SEs are below the estimates (excerpt) enter image description here

Where column 1- 4 are different samples, with 1 being a pooled sample of all others.

Now it seems reasonable to control for each individuals education level which yields the following results: enter image description here
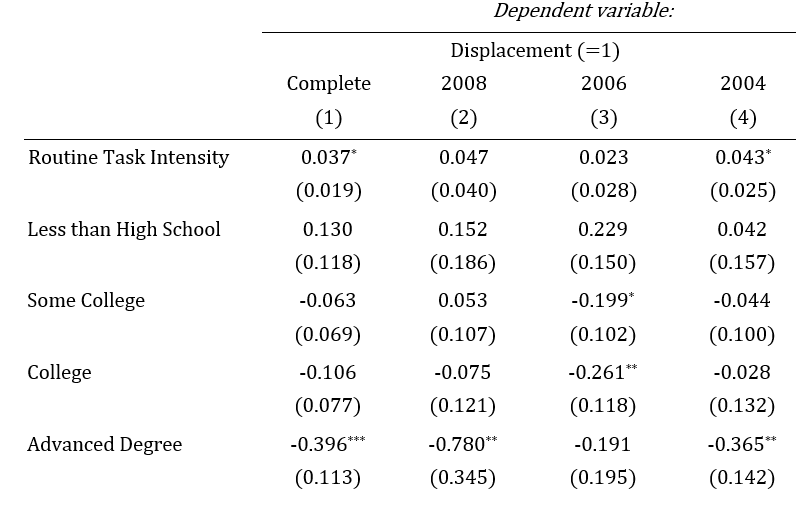
Where the education levels are dummy variables and high school is the comparison group.

Now my problem:

1.

It is reasonable to assume that the Routine Task Intensity of ones occupation correlates with the individuals education. I have though about doing an ANOVA but Routine Taks Intensity is not normaly distributed (though sample size is large ~21000). Is the any way to test correlation between education and Routine Taks Intensity? Maybe a non-parametric approach?

2.

How do I interpret the change in significance and effect size given that Routine Task Intensity still has roughly the same standard errors? My understanding of multicolinearity is that it inflates the variance. Can I say that education takes away from the explanatory power of Routine Taks Intensity? Since before Routine Task Intensity unjustly captured some of the effect that should actually be attributed to education?

Any help is greatly appreciated.

If any of my questions have already been covered I am grateful to anyone that can point me to the other posts. I have however spent several hours looking for similar questions and have not found one with a statisfactory answer with regards to my problem.

$\endgroup$
4
  • $\begingroup$ What does your response variable actually look like? Just a binary success failure? ANOVA is not appropriate from what I can see - it rarely is appropriate unfortunately because it has very strict assumptions. Logit is not a model type, just a transformation, although it is commonly associated with logistic/binomial models. $\endgroup$
    – André.B
    Commented Feb 17, 2019 at 22:06
  • $\begingroup$ Thanks for your reply. The response is indeed just a binary indicator of success or failure - here whether the individual has lost her/his job. Thanks for clearing up the difference between logit and the logisitic model, I was never entirely clear on that! $\endgroup$
    – Jonas C
    Commented Feb 18, 2019 at 9:47
  • $\begingroup$ Have you had any success? $\endgroup$
    – André.B
    Commented Feb 24, 2019 at 20:05
  • $\begingroup$ Hey thanks for your answer! Yes I had success, especially the VIF was a lot of help! I also figured out how the multicollinearity, omitted variable bias and variance of the error terms interact, which is able to explain my second question. Thanks for your help! $\endgroup$
    – Jonas C
    Commented Feb 27, 2019 at 9:39

1 Answer 1

2
$\begingroup$

I think you have two options you could explore here model wise.

1) You could check the 'variance inflation factors' (VIFs), which will identify highly correlated variables. To do this you construct a generalised linear model with binomial errors (I.e. a logistic model) with the full compliment of covariates. If you do this in R you can check the VIFs with car::vif(model). Here is a walk through on how to do this and interpret the results.

2) An alternative is to use some kind of regularised regression model. There are three kind primarily; ridge, lasso and elastic net. All three of these techniques were developed to deal with (multi-)collinearity by shrinking coefficients. The catch is that you have to estimate the 'cost' parameter which is effective how much the coefficients are shrunken by. The good news is that it is quite easily done by techniques like cross-validation. This may sound intimidating if you haven't come across if before but it really isn't. There are two packages in R; caret and glmnet which can do the estimating for you. Here is a good tutorial on fitting regularised regression models with glmnet.

$\endgroup$

Your Answer

By clicking “Post Your Answer”, you agree to our terms of service and acknowledge you have read our privacy policy.

Not the answer you're looking for? Browse other questions tagged or ask your own question.