I have an unusual problem, which is that my model is performing too well and I am struggling to trust it.
The data is a table of "snapshots" about moments in games of chess. For example, a game that lasted 20 minutes might have 4 observations in the data, corresponding to the state of play at 1, 6, 11 and 16 minutes into the game. Features are things like how many moves my player has made, how many pawns he's lost, whether he's lost his queen and so on. The target feature on each observation is whether or not this player eventually won the game, and that's what I want to predict.
I trained a model (a RandomForestClassfier) on a bunch of data. The outcome was a 0.929 Accuracy and 0.983 AUC score; that score is so high that I struggle to trust it, so i want to validate it as securely as possible.
Strangely, the model doesn't seem to be significantly overfitted:
rfc = RandomForestClassifier(n_jobs=6, max_depth=15)

x_train, x_test, y_train, y_test = train_test_split(
    df_full.drop(
        'Status',
        axis=1
    ),
    df_full.Status
)

rfc.fit(x_train, y_train)

print('Train Score: ',
      rfc.score(x_train, y_train),
      'Test Score: ',
      rfc.score(x_test, y_test),
      'Test AUC Score: ',
      roc_auc_score(y_test, rfc.predict_proba(x_test)[:,1])
     )
Train Score: 0.9350048879188833 Test Score: 0.929179472533281 Test AUC Score: 0.9832906048250383
It's performing slightly better on the training set (750k observations) compared to the testing set (250k), but only by about 0.005 accuracy score. I've also performed cross validation using StratifiedKFold(shuffle=True, n_splits=5) and gotten similar scores. Now the character of some features in the dataset are changing over time. For example for newer observations the "GameLength" feature is trending firmly downwards and the player is getting better and better, winning more often:

So I decided to test the possibility that I'm overfitting to the earlier observations some how by splitting a random sample out of the dataframe, then scoring the model against observations from the sample with CreatedDate < 2018-01-01 and against observations from the sample with CreatedDate >= 2018-01-01. This does seem to bear out that hypothesis:
df_s = df.sample(frac=0.25)
df = df.drop(df_s.index)
df_s_1 = df_s.loc[df_s.CreatedDate < '2018-01-01']
df_s_2 = df_s.loc[df_s.CreatedDate >= '2018-01-01']

rfc = RandomForestClassifier(n_jobs=6, max_depth=15)

x_train, x_test, y_train, y_test = train_test_split(
    df.drop(
        'Status',
        axis=1
    ),
    df.Status
)

rfc.fit(x_train, y_train)

print('Full Train Score: ',
      rfc.score(x_train, y_train),
      'Full Test Score: ',
      rfc.score(x_test, y_test),
      'Holdout Pre 2018 Score: ',
      rfc.score(df_s_1.drop('Status', axis=1), df_s_1.Status),
      'Holdout Post 2018 Score: ',
      rfc.score(df_s_2.drop('Status', axis=1), df_s_2.Status)
     )

Full Train Score:  0.9285909152912291
Full Test Score:  0.9207593281991532
Holdout Pre 2018 Score:  0.9304484856471416
Holdout Post 2018 Score:  0.889780437600061
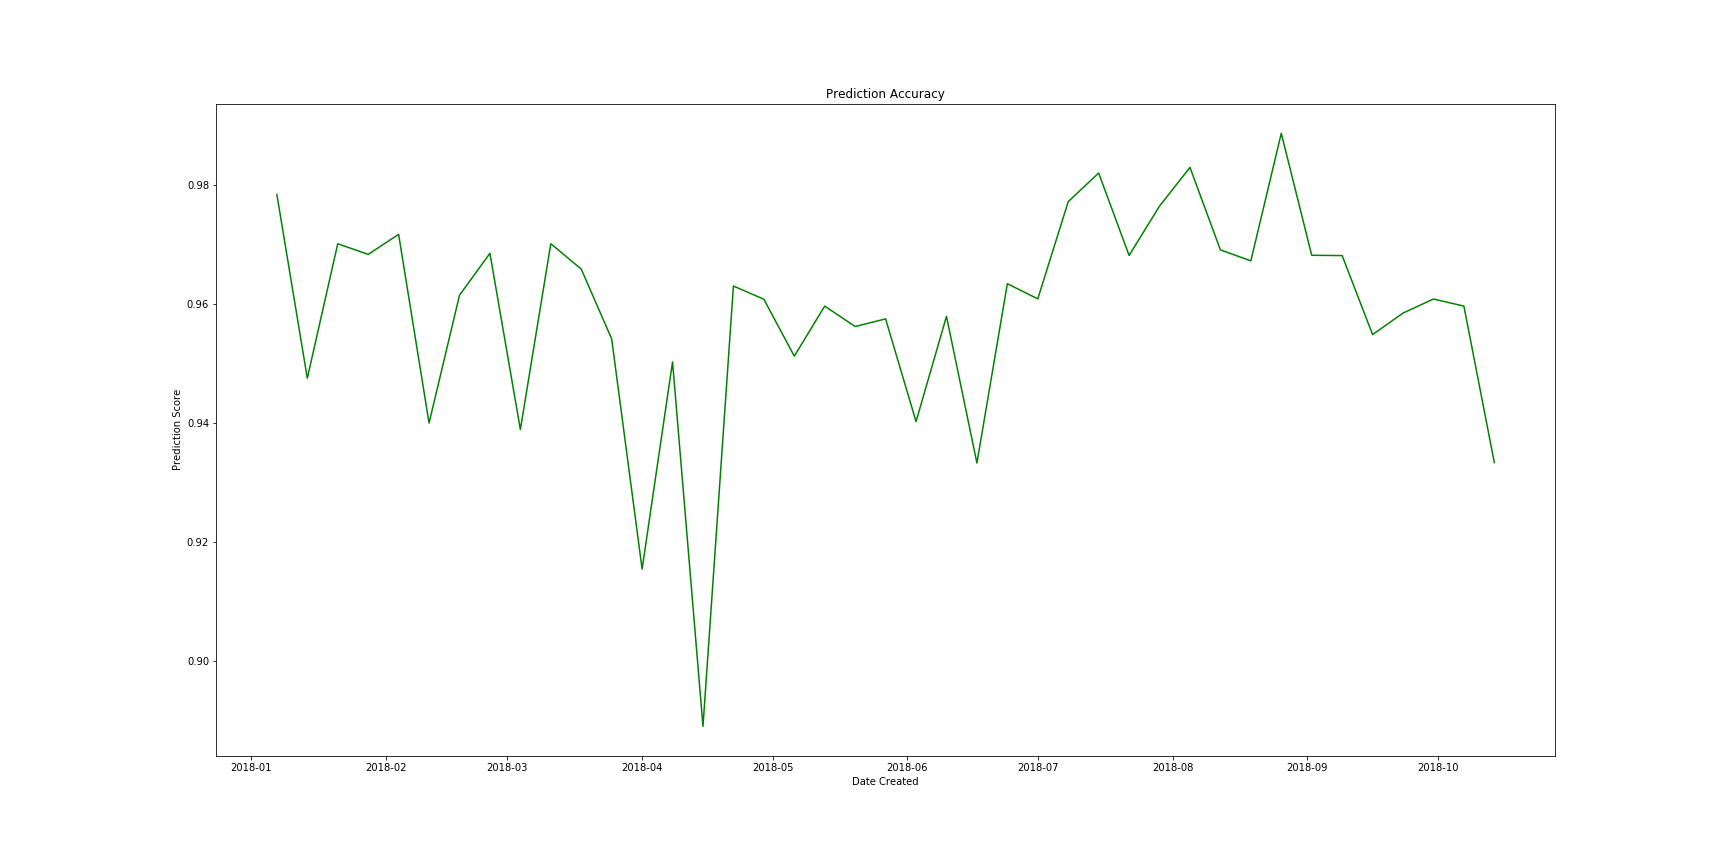
We can see that the Post-2018 Score is significantly lower than the Pre-2018 score. This problem is not specific to the holdout data however. If I compare the prediction accuracy against the main set, they follow broadly equivalent patterns:
Which would seem to imply the model is reasonably well fit and that it simply predicts new observations less well; presumably because they're drowned out by the much larger number of earlier observations and their different characteristics. With that being the case, I retrained the model on just those observations later than 2018-01-01 to the following results:
df3 = df.loc[df.CreatedDate >= '2018-01-01'].drop(['score', 'Correct_Prediction'], axis=1)

x3_train, x3_test, y3_train, y3_test = train_test_split(df3.drop(['CreatedDate', 'Status', 'LifeBin'], axis=1), df3.Status)

rfc3 = RandomForestClassifier(max_depth=15, n_jobs=6)

rfc3.fit(x3_train, y3_train)

print('Train Score: ',
      rfc3.score(x3_train, y3_train),
      'Test Score: ',
      rfc3.score(x3_test, y3_test)
     )
Train Score: 0.9588592284513856 Test Test Score: 0.9382511713179874
There's now much less of a trend, and the model is back to its previous good level of performance. I'm out of ideas to poke holes in that score now, so my question is is there anything else I can do to test the validity of that score?


