5
$\begingroup$

I am supposed to show the hazard ratio (HR) stratified by gender (1= female vs. 2= male) and age groups (quartiles, 1-4)*. The combination "female" and "first quartile of age" is supposed to be the reference, i.e. having a HR of 1.

The plot should look like that: How the plot should look like
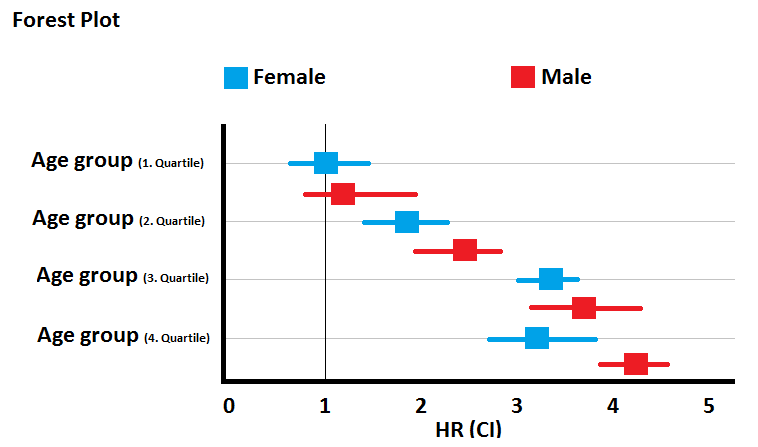
Since every group combination (2nd quartile and female, 1st quartile and male,...) is supposed to show the HR in comparison to the refernce (female and 1st quartile of age group), I am wondering whether I can firstly code both variables as one joint variable and afterwards make dummy variables (D1- D7) out of it like that:

Age groups   Gender    Joint variable   D1   D2   D3   D4   D5   D6   D7
(quartiles)  (1=f,2=m)
1            1         1                0    0    0    0    0    0    0
1            2         2                1    0    0    0    0    0    0
2            1         3                0    1    0    0    0    0    0
2            2         4                0    0    1    0    0    0    0
3            1         5                0    0    0    1    0    0    0
3            2         6                0    0    0    0    1    0    0
4            1         7                0    0    0    0    0    1    0
4            2         8                0    0    0    0    0    0    1

My idea is to use those dummy variables as predictors in a Cox model. The interpretation of HR= 2 for D7, for example, would be something like "Being old (4th quartile) and male is associated with a twofold risk of mortality versus being young (first quartile) and female". Is this a valid approach? I haven't read about cases where a joint dummy coding was used for two different variables and can't find any resource online.

* Notice to the usage of age groups: I know that there are problems associated with splitting up a continuous variable in groups, but this is what I am supposed to do.

$\endgroup$
2
  • $\begingroup$ This seems to be about how to code a calculation -- in some unstated language with no code visible. It's hard to know what kind of answer you expect. Please see advice in the Help Center on software-specific questions, which usually belong elsewhere. $\endgroup$
    – Nick Cox
    Commented Apr 2, 2019 at 10:04
  • 1
    $\begingroup$ This question is in no sense about any software. The question is wehter or not this is a valid approach, regardless of the software being used. $\endgroup$
    – user213325
    Commented Apr 2, 2019 at 10:08

1 Answer 1

4
$\begingroup$

The joint variable of two factors is their interaction (and that is what you have hand-coded in D1,..., D7.) In R, if Gender and Age are the two factors, this can be done as in the code snippet below:

set.seed(7*11*13) 
Gender <- factor( sample(c("Male", "Female"), 100, replace=TRUE)) 
Age <- factor( sample(c("Q1", "Q2", "Q3", "Q4"), 100, replace=TRUE)) 
table(Gender, Age)
        Age
Gender   Q1 Q2 Q3 Q4
  Female 15  8  8 17
  Male   14 14 11 13

Then to make the interactions variable:

mydf <- data.frame(Age=Age, Gender=Gender) 
tab <- model.matrix( ~ (Gender:Age) - 1, mydf)

and now you can compare with your manually constructed variable. See also https://stackoverflow.com/questions/2080774/generating-interaction-variables-in-r-dataframes. This way we have constructed the dummies for the interaction. Maybe more useful, we can also construct a new factor variable which codes the interaction. This is simple:

mydf$D <- with(mydf,  interaction(Age, Gender))
 with(mydf, table(D))
D
Q1.Female Q2.Female Q3.Female Q4.Female   Q1.Male   Q2.Male   Q3.Male   Q4.Male 
       15         8         8        17        14        14        11        13 

and now D can be used directly in formulas.

EDIT

As for questions in comments: Yes, you can use the 7 dummies. But logically, the variable is represented by the full set of 8 dummies, and sometimes we want them all. If I replace my code above ~ (Gender:Age) - 1 with ~ (Gender:Age) then (try it) you will get the 7 dummies, but you will also get the intercept, which was omitted by my code (that is what -1 does.) See What algorithms need feature scaling, beside from SVM? for a case where you do not want to drop one dummy!

$\endgroup$
1
  • 1
    $\begingroup$ Thank you! Why are there 8 dummies for 8 groups in the output of model.matrix(...)? Usually, creating dummies gives you k-1 dummies for a group with k levels and thus my table has only 7 dummies for 8 groups. Interestingly, using lm(rnorm(nrow(mydf)) ~ Age + Gender + Age*Gender, mydf) gives 7 dummies (as I expected) while the analog code for your model.matrix() in lm(rnorm(nrow(mydf)) ~ Age:Gender, mydf) gives 8 dummies. One of the 8 dummies has a NA anyway, so I can simply use the 7 dummies as I described? $\endgroup$
    – user213325
    Commented Apr 3, 2019 at 13:23

Your Answer

By clicking “Post Your Answer”, you agree to our terms of service and acknowledge you have read our privacy policy.