1
$\begingroup$

I have some data of lizard counts near rock piles of different types that I'm trying to analyse.

There are three different types of rocks (control, design 1, and design 2) and I have a lizard count for each pile, so my table is a 1 x 3 contingency table. The observed values were control = 8, design 1 = 17, design 2 = 2.

However, one of the expected counts is below 5 (expected counts are 11.25, 11.25, and 4.5, based on the proportions of different rock piles at the site). Does this violate the assumption of the chi-squared test? If so, what test can I use (I believe Fisher's exact test doesn't work when there's only one row?)

$\endgroup$
4
  • 1
    $\begingroup$ Are you familiar with Barnard's test? en.wikipedia.org/wiki/Barnard%27s_test $\endgroup$ Commented Apr 30, 2019 at 5:36
  • 2
    $\begingroup$ Chi-sq test may be OK. The risk would be that the chi-squared statistic may not have exactly a chi-squared distribution under $H_0.$ But there are ways to get an exact P-value. Can you give observed values? $\endgroup$
    – BruceET
    Commented Apr 30, 2019 at 7:29
  • 2
    $\begingroup$ Out of curiosity (if you're able to say), how do those expected values arise? $\endgroup$
    – Glen_b
    Commented Apr 30, 2019 at 9:42
  • $\begingroup$ Thanks for the comments. Frans, I am not familiar with it, from a brief googling it seems to be recommended for 2x2 and I can't see a method for 1x3 tables? $\endgroup$
    – OxL
    Commented Apr 30, 2019 at 23:16

2 Answers 2

7
$\begingroup$

The "expected count >5" is not an assumption of the test. It's a rough rule of thumb relating to the adequacy of the chi-squared approximation to the distribution of the test statistic.

An expected value of 4.5 shouldn't be all that big of a problem. However we can check how much effect it has, using simulation.

I've just done a large simulation for your specific sample size and null-probabilities; the relationship between the true significance level and the chisquared approximation is pretty good for significance levels below 20%:
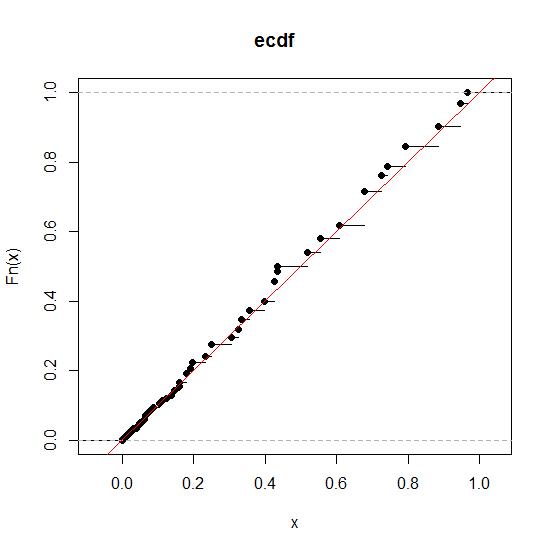
ECDF of simulated p-values under H0 for population proportions of 5/12, 5/12, 2/12 and n=27

The above plot shows the empirical cdf of simulated p-values under $H_0$ for population proportions of $\frac{5}{12},\frac{5}{12},\frac{2}{12}$ and $n=27$. Those "wobbles" away from the y=x line in the top 3/4 of the plot are not random, but reflect the actual distribution (there is randomness in the plot but it's mostly too small to discern in that plot; repeat simulations look the same).

In addition we can compute from the same simulations that the true significance level for a nominal 5% chi-squared test is about 4.7% which is slightly conservative (this is on 300,000 simulations). The chi-squared approximation seems reasonably adequate to me.

However, you can perform an 'exact' test (to any desired degree of accuracy on the estimated significance level) for any given statistic (such as the Pearson chi-squared statistic) by using the simulated distribution under the null. Indeed a perfectly-exact test could be obtained by enumeration (at least in the upper tail), but involves more effort.

In some cases the G-test for multinomial goodness of fit (which is also asymptotically chi-squared) has a slightly better approximation to the chi-squared distribution in small samples. We can also check that, but in this case the approximation appears to be slightly worse in the region of 5%. An exact test based on simulation could be performed for this case as well.

A variety of other choices of test are possible and for any given test statistic exact tests may be constructed if need be.

$\endgroup$
2
$\begingroup$

This is more of a comment to @Glen_b's answer. We can do the test in R, with and without simulation. The resulting p-values are rather close.

p <- c(11.25, 11.25, 4.5)
p <- p/sum(p)

mytab <- c(8, 17, 2) 

> chisq.test(mytab, p=p)

    Chi-squared test for given probabilities

data:  mytab
X-squared = 5.2667, df = 2, p-value = 0.07184

Warning message:
In chisq.test(mytab, p = p) : Chi-squared approximation may be incorrect

> chisq.test(mytab, p=p, sim=TRUE, B=10000)

    Chi-squared test for given probabilities with simulated p-value 
    (based on 10000 replicates)

data:  mytab
X-squared = 5.2667, df = NA, p-value = 0.07429

So simulation, in this case, leads to a slightly larger p-value.

$\endgroup$
1
  • 3
    $\begingroup$ Re "slightly larger p-value:" the difference can be attributed to chance (the z-score is a little less than 1.0). You would need a larger simulation to justify that conclusion (which happens to be correct, since $p=0.07942336\ldots,$ but not by virtue of this particular result). Also, as a computational matter, since there are only 406 possible outcomes summing to $27,$ you might as well compute the exact distribution rather than simulating it. $\endgroup$
    – whuber
    Commented Mar 5 at 16:50

Your Answer

By clicking “Post Your Answer”, you agree to our terms of service and acknowledge you have read our privacy policy.

Not the answer you're looking for? Browse other questions tagged or ask your own question.