I have this data which is residual series obtained from predicted values and observations. original series was a random walk with a very small drift(mean=0.0025).
err <- ts(c(0.6100, 1.3500, 1.0300, 0.9600, 1.1100, 0.8350 , 0.8800 , 1.0600 , 1.3800 , 1.6200, 1.5800 , 1.2800 , 1.3000 , 1.4300 , 2.1500 , 1.9100 , 1.8300 , 1.9500 ,1.9999, 1.8500 , 1.5500 , 1.9800 ,1.7044 ,1.8593 , 1.9900 , 2.0400, 1.8950, 2.0100 , 1.6900 , 2.1800 ,2.2150, 2.1293 , 2.1000 , 2.1200 , 2.0500 , 1.9000, 1.8350, 1.9000 ,1.9500 , 1.7800 , 1.5950, 1.8500 , 1.8400, 1.5800, 1.6100 , 1.7200 , 1.8500 , 1.6700, 1.8050, 1.9400, 1.5000 , 1.3100 , 1.4864, 1.2400 , 0.9300 , 1.1400, -0.6100, -0.4300 ,-0.4700 ,-0.3450), frequency = 7, start = c(23, 1), end = c(31, 4))
and I know this residual series has some seriel correlations and can be modeled by ARIMA.
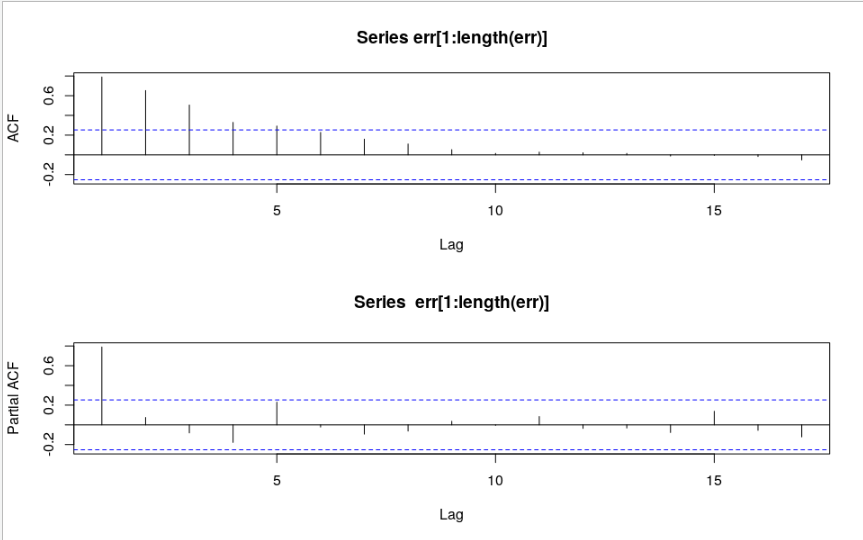
acf(err[1:length(err)]);pacf(err[1:length(err)])
# x axis starts with zero.
# showing only integer lags here, same plot as full seasonal periods.
# shows it typically can be fitted by a MA model.
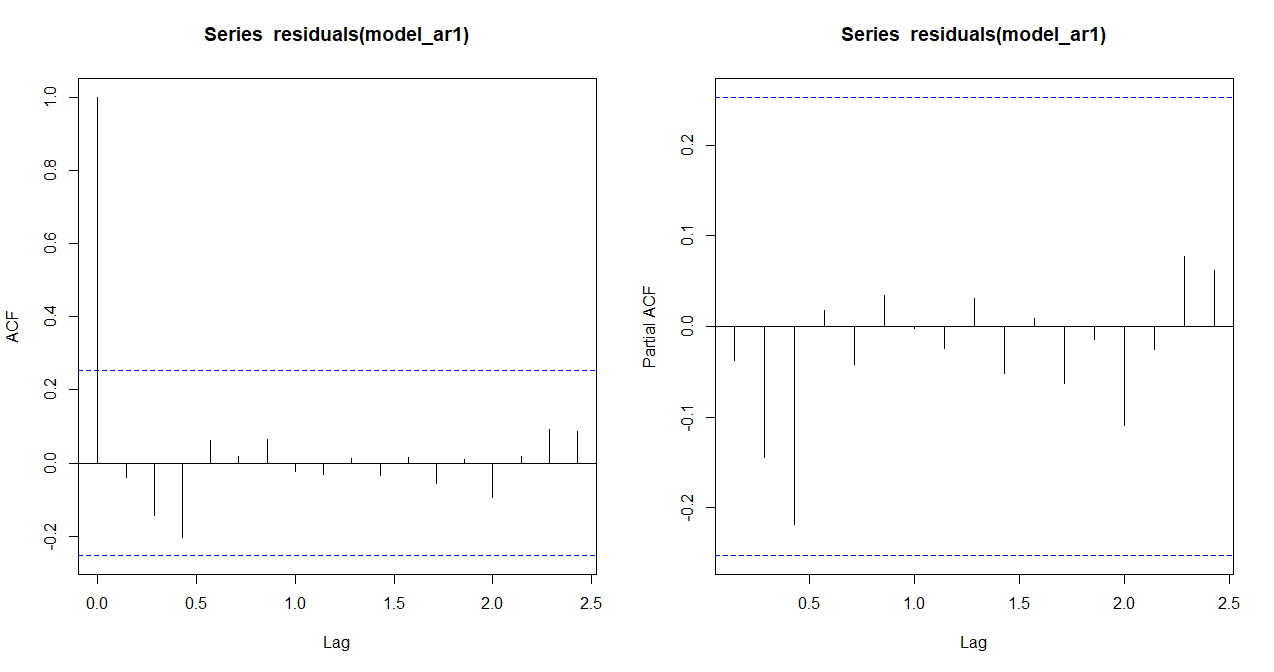
I have attempted following fittings:
library(forecast)

m1 <- auto.arima(err, stationary=T, allowmean=T)
#output
# ARIMA(2,0,0) with zero mean

# Coefficients:

#         ar1     ar2
#      0.7495  0.2254
# s.e.  0.1301  0.1306

# sigma^2 estimated as 0.104:  log likelihood=-17.65
# AIC=41.29   AICc=41.72   BIC=47.58

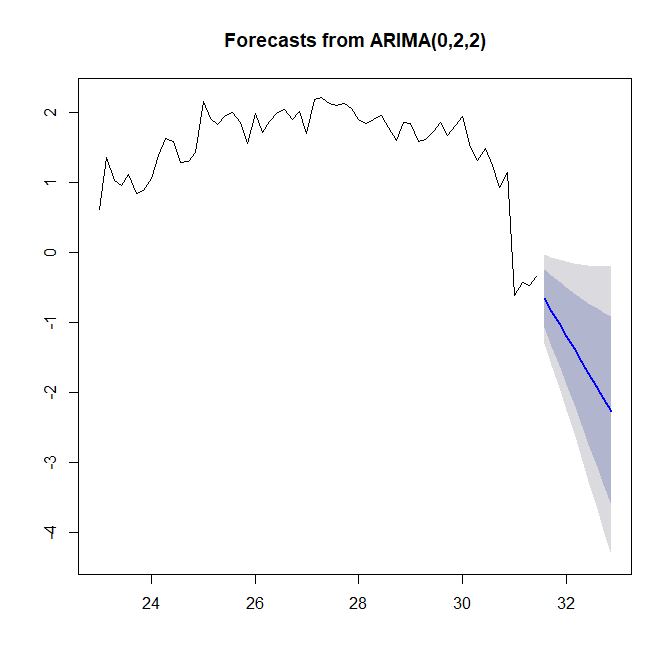
m2 <- auto.arima(err, allowmean=T)
# output
# ARIMA(0,2,2)

# Coefficients:
#          ma1     ma2
#      -1.3053  0.3850
# s.e.   0.1456  0.1526

# sigma^2 estimated as 0.1043:  log likelihood=-16.97
# AIC=39.94   AICc=40.38   BIC=46.12
From the acf and pacf of err we can see that it is to be fitted by an MA model rather than AR, why does auto.arima give me an AR fit?


