The software I'm using for this task is R. I am looking at three things :
How one continuous variable is affected by three categorical variables, two with two levels one with four levels.
Which level in each category affects the continuous variable the most.
The individual "weight" and significance of each category in predicting the continuous variable, and the interactions between them. For example, do category 1 level 2 and category 3 level 4 have a significant effect on the continuous variable more than category 1 level 2 and category 3 level 1?
I know I should use either a GLM or a LM, but I cannot work out which - I have run both in R and come up with different results, which apparently shouldn't happen.
A brief overview of the correct model output would be greatly appreciated.
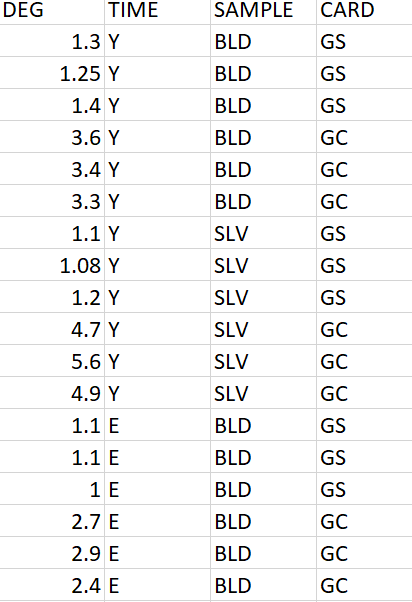
my data looks like this
continuious varaible DEG Time (year, eight, two,day) sample (BLD, SLV) Card (GS, GC)
This is my code for both:
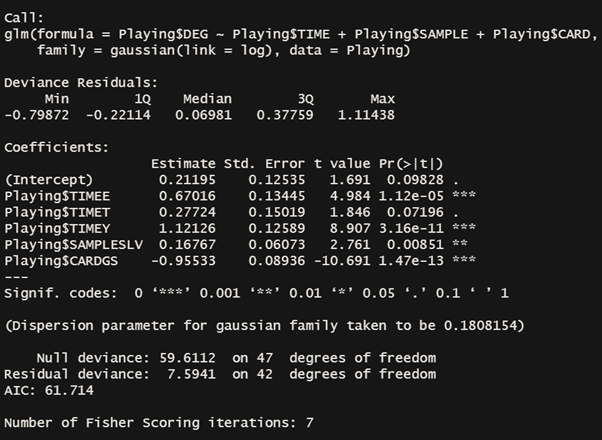
glm(Playing$DEG ~ Playing$TIME + Playing$SAMPLE + Playing$CARD,family = gaussian(link = log), data = Playing)

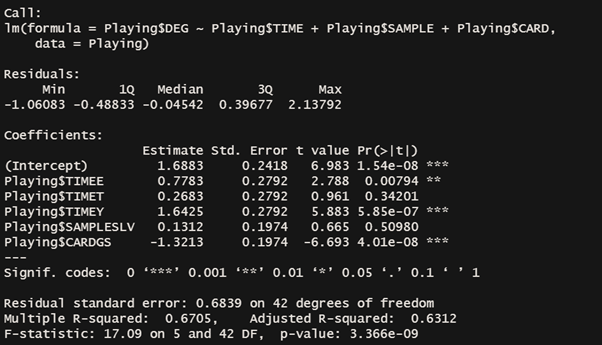
lm(Playing$DEG ~ Playing$TIME + Playing$SAMPLE + Playing$CARD,data = Playing)
I have already converted the predictors to factors.
My main issue is according to the research I have done both my GLM and LM models should give the same (or close enough) results - for some reason this isn't happening in R I cannot see an error in my code thus I must have misunderstood something along the way therefore which results do I use - GLM or LM model ? and how does this give me the interactions between/weight of the factors ?
Thanks for putting up with this confused new user !


lmdoes not use a log link: it is tantamount to using an identity link inglm. Please read the help page forfamilyfor more information. $\endgroup$