3
$\begingroup$

I have about 1000 data points, I'm trying to run a $t$-test because my points are divided in 2 groups and I want to compare them. The results of Shapiro-Wilk normality test:

W = 0.95753, p-value = 1.428e-09

I've read that it doesn't work for more than about 30 points so I've run KS:

One-sample Kolmogorov-Smirnov test
D = 0.073827, p-value = 0.001656

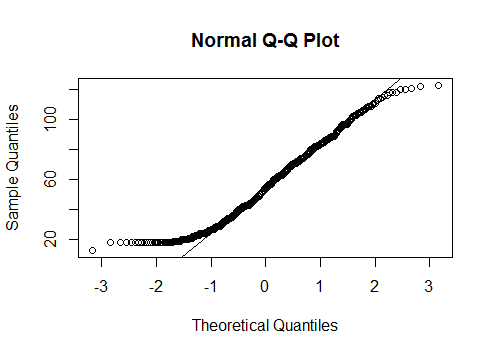
So I run QQ plot and it looks to me that most of the points are really very close to the line, but I see also those tails and I'm not sure.

Is there any other test I could use? is ok this QQ plot with those tails?enter image description here

$\endgroup$
4
  • $\begingroup$ Based on the plot, it does have tails. If you are still not convinced why don't you check for kurtosis and skewness? $\endgroup$ Commented Jun 16, 2019 at 10:04
  • $\begingroup$ Also nortest package provides few other normality tests like anderson-darling and few other tests too $\endgroup$ Commented Jun 16, 2019 at 10:05
  • 3
    $\begingroup$ The question is missing context. Why do you care? Why not use the fact that the Wilcoxon test works fine under normality? Why assume that a test of normality has a power close to 1.0? $\endgroup$ Commented Jun 16, 2019 at 12:39
  • $\begingroup$ As an interpretation help for qqplots, simulation might be better help than formal tests. See stats.stackexchange.com/questions/111010/… for ideas! $\endgroup$ Commented Oct 6, 2021 at 16:29

3 Answers 3

1
$\begingroup$

Considering the tails, it is not unexpected that normality tests come out significant. If your concern is that your samples violate the normality assumption for Student's t test, you may turn to the non-parametric, Mann–Whitney U test which does not require such assumption.

$\endgroup$
10
$\begingroup$

1) I'm not quite sure whether you're asking the right question anyway. If you have two groups, you need to look at the two groups separately for checking normality. If the two groups are both normal but with different means, the distribution you have from throwing both groups together is a mixture of normals, which is not itself a normal.

2) There is no reason not to believe the test results in the sense that there is strong evidence that the data are not normal. You seem to not like this result and you seem to want the data to be normal, and therefore you're asking for something else. But whatever you try next and whatever the result is, it won't cancel out the results of the two tests you already tried (every test tests the normal distribution against different "ways of being wrong", so you may find one that doesn't reject it, but still it'll hold what the tests found that you have already used, particularly given that the p-values are so low that there is little ambiguity).

3) Also, as was pointed out before, your plot in fact shows that the tails of your distribution are thinner than those of a normal distribution. A distribution that looks like a normal in the middle but not in the tails is not a normal, so normality is correctly rejected by your tests.

4) Now here's some qualification.

a) The normal distribution never holds precisely in practice, so if you have many points (1000 is a fairly large sample though not exactly big data), a test will pick up any small deviation from the normal and reject normality, despite the fact that the distribution can still be fairly similar to a normal and the t-test may still be fine, if only approximately. This particularly means that at least for large enough sample sizes the fact that a test rejects normality isn't a conclusive argument not to use a t-test.

b) In your case the tails look too thin, but in my experience (there is some scattered literature exploring this by simulation, but I'm frankly too lazy to search for half an hour to give you good references) big problems for the t-test come from strong skewness and heavy tails, which you don't seem to have, whereas for thinner tails the normal and the (for sample sizes going to infinity equivalent) t-approximation is usually very good. So if there isn't any other problem (see issue (1), or with independence or equal variances), I would go ahead with the t-test anyway. (If a "scientific" argument is required, one could cite the Central Limit Theorem, however this hides the issue that some deviations from the normal are on fact a problem and some others are not.)
$\endgroup$
5
$\begingroup$

I've read that it doesn't work for more than about 30 points so I've run KS:

What's your source for this claim? The Shapiro-Wilk test works fine with larger sample sizes. For example, the R implementation of the test by the function shapiro.test works for sample sizes between 3 and 5000. I'd recommend reading the answers to the question Is normality testing essentially useless? on this site. Generally speaking, with such a large sample size, even miniscule deviations from normality get "picked up" by these tests even though they might not be a problem for the application of a $t$-test (see below).

So I run QQPlot I attath it here, looks to me that most of the points are really very close to the line, but I see also those tails and I'm not sure.

You are speaking about a two-sample $t$-test but present only one QQ plot (and normality test results). The normality assumption holds for both groups separately, not the joined distribution. Anyway, the QQ plot seems to indicate the presence of light tails (see here for a very nice overview of how to interpret QQ plots). The QQ plot certainly provides evidence that the distribution is incompatible with a normal distribution in the sense that the normal distribution would serve as good model for the data.

Is there any other test I could use? is ok this QQplot with those tails?

The real question lurking here is: Does the apparent deviation from normality of the data raise concerns about using the $t$-test?

A couple of thoughts: If your concerned that your data doesn't fulfill the assumptions of the $t$-test, it's probably best to just use a non-parametric alternative, such as the Mann-Whitney $U$ test without unleashing a battery of normality tests (or other tests such as Levene's test) first. Because the inference of the $t$-test will be conditional on those normality tests, it may not have the operating characteristics postulated (neither will the Mann-Whitney $U$ test if selected conditional on another test). I found the paper by Rochon et al. (2012) an informative source for this.

In addition, note that the Mann-Whitney $U$ test has a different null hypothesis than the $t$-test and generally does not compare means. The Mann-Whitney $U$ test is nearly as efficient as the two-sample $t$-test if the underlying distributions are normal and more efficient if the underlying distributions are non-normal (see here).

On the other hand, the $t$-test is quite robust to deviations from normality. Specifically, it is more sensitive to deviations in the form of skewness than in the form of kurtosis (see here). The QQ plot doesn't provide much evidence for large deviations from skewness, as far as I can see. Coupled with the large sample size of $n=1000$, a $t$-test probably works well here. But again, the assumptions of the $t$-test concern the distribution of both groups separately.

Other alternatives include bootstrapping or permutation tests.

$\endgroup$
2
  • 1
    $\begingroup$ Agree with most of this, however, if one chooses Mann-Whitney conditionally on looking at the data or normality testing with a t-test in mind first, Inference from Mann-Whitney will be theoretically as compromised by conditioning as inference from the t-test. Although in practice that problem is probably tiny for both tests. $\endgroup$ Commented Jun 16, 2019 at 12:28
  • 1
    $\begingroup$ @Lewian I completely agree about the potential problems with conditional testing. That's why I wrote that the decision for a test should be made prior to any normality testing or other tests. Simulation studies confirm this (e.g. Rochon et al. 2012). $\endgroup$ Commented Jun 16, 2019 at 12:35

Your Answer

By clicking “Post Your Answer”, you agree to our terms of service and acknowledge you have read our privacy policy.

Not the answer you're looking for? Browse other questions tagged or ask your own question.