1
$\begingroup$

I'm simulating the overall usage of a cluster using historic deployment data. Due to the nature of the simulation, there are some heavy points (i.e. very low overall usage). As a result, the variance blows up.

Naturally, I thought of using robust statistics (i.e. median and MAD) in order to account for the big spread of the data. However, I want to compare different "admission policies" for a cluster (i.e. compare different groups). Each group has a sample size of 100.

In the original paper (with theoretical data), the mean and standard error of the mean were used to compare the different groups. I want to do the same.

Is it scientifically correct to compare groups based on $\text{median}(X)\pm \text{MAD}(X)$? Or should I use $\text{median}(X) \pm \frac{1}{n}\sum_{i=1}^n |X_i - \text{median}(X)|$?

$\endgroup$
3
  • $\begingroup$ Basically it is up to you as long as you clearly state what the values mean. Boxplots could be an interesting option as well. $\endgroup$
    – Michael M
    Commented Jun 22, 2019 at 11:13
  • 1
    $\begingroup$ Yes boxplots could be interesting, I 'll give it a try. I also thought about tehe standard error of the median as a measure of the goodness of the estimate. $\endgroup$ Commented Jun 22, 2019 at 12:17
  • $\begingroup$ Good idea. "Notched" boxplots would show rough approximations of these standard errors as well. $\endgroup$
    – Michael M
    Commented Jun 22, 2019 at 12:46

1 Answer 1

2
$\begingroup$

It is not clear what kind of 'admission criterion' you want. If the original paper used the interval $\bar X \pm S/\sqrt{n},$ then that is something like a 68% confidence interval.

If you are happy using confidence intervals, then a reasonable approach might be to use the nonparametric CI available in R from the one-sample Wilcoxon procedure.

Suppose you have Laplace data which shows more outliers than does normal. Then to get a 95% CI that is reasonably robust to outliers you could use R as shown below. (You can choose any confidence level you like.)

Nonparametric CIs for Laplace data. I used a Laplace distribution with centered at $\mu = \eta = 15.$ The Wilcoxon interval includes this value. (And so does the t interval, which assumes normal data and has a length slightly inflated by the outliers.)

set.seed(2019)
x = rexp(100, .1) - rexp(100, .1) + 15
boxplot(x, horizontal=T, col="skyblue2", pch=19, notch=T)

wilcox.test(x, conf.int=T, conf.lev=.95)$conf.int
[1] 13.41728 17.74237
attr(,"conf.level")
[1] 0.95

t.test(x)$conf.int
[1] 13.85243 19.03257
attr(,"conf.level")
[1] 0.95
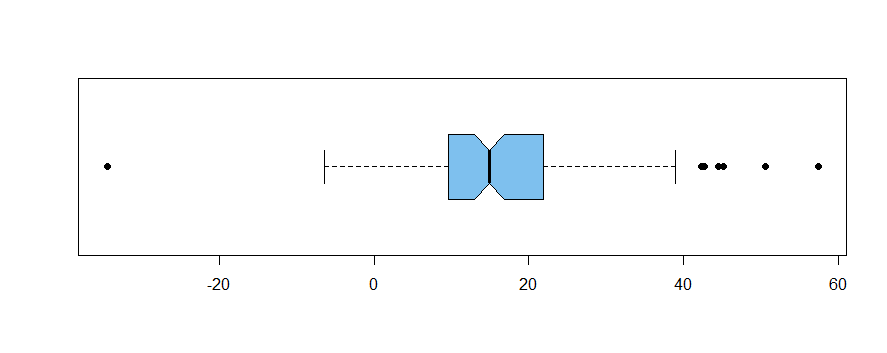
enter image description here

The notches in the sides of the box show a nonparametric confidence interval, the level of which is calibrated for a comparison of two such boxplots (see R documentation).

Robust statistics. If you want to use median and MAD, you could use R to get the intervals below, as you suggest in your Question:

median(x) + c(-1,1)*mad(x)
[1]  6.361976 23.546726
median(x) + c(-1,1)*mad(x, const=1)
[1]  9.158873 20.749829

If you use mad in R, you should read its documentation page to understand the role of the default built-in constant multiplier, which you can override as in my second interval above.

Then I suppose you would want to do simulations based on several possibly relevant long-tailed distributions in order to understand the coverage properties of whatever type of interval you choose to use.

$\endgroup$
3
  • $\begingroup$ Thank you for your detailed answer. I don't think nonparametric methods are viable, as the "outliers" in our simulation come from a fault of our model (it has to do with the problem of artifically estimating the population of a server/cluster at any given time). Thus the outliers must not be considered as important. However I am interested in the approximative 68% CI using the standard error of the mean. Could you provide a link or explanation on this? - I would highly appreciate it. $\endgroup$ Commented Jun 22, 2019 at 21:28
  • $\begingroup$ (a) Rank-based nonparametric tests using ranks (such as Wilcoxon) are robust against outliers. (Even the hugest outlier only counts as highest-ranked observation.) IMHO: You should not dismiss them. (b) For $n=100,$ the interval $\bar X \pm (1.0)S/\sqrt{n}$ is a 68% CI for $\mu$ based on roughly normal data because 68% of probability in $\mathsf{T}(99)$ dist'n is btw $\pm1.$ // Please clarify exactly what you are doing: I understand you want some sort of interval. Can you say how a desirable interval is used to "admit" a "cluster"? And is a 'cluster' same as a 'group'. $\endgroup$
    – BruceET
    Commented Jun 22, 2019 at 23:03
  • $\begingroup$ Okay, I'll have a look at the Willcox test. Maybe there is a clash of definitions here, a "cluster" refers to multiple servers bundled together (thus not a statistical term). We analyse different cluster admission policies and want to compare them, using the the overall usage (in terms of occupied cores). We have only 1 month worth of data and need to estimate a cluster that is already in use. To do so, we bootstrap start/left censored jobs . There are some artifacts in our data that may cause a very poor overall usage (if they are drawn too often). $\endgroup$ Commented Jun 23, 2019 at 7:02

Your Answer

By clicking “Post Your Answer”, you agree to our terms of service and acknowledge you have read our privacy policy.

Not the answer you're looking for? Browse other questions tagged or ask your own question.