7
$\begingroup$

Hypothesis testing such as Anderson-Darling or Shapiro-Wilk's test check normality of a distribution. However, if the sample size is very large, the test is extremely "accurate" but practically useless because the confidence interval is too small. They will always reject the null, even if the distribution is reasonably normal enough.

How should I test normality when sample size is very large, other than visualizing histograms?

The motivation is that I want to automate checking normality of large data set in a software platform, where everything needs to be automated, not manually visualized and inspected by humans.

One thing that came across me is that instead of using Shapiro-Wilk test, I calculate kurtosis and skewness of the distribution, and if they are $\pm 1.0$, I can assume that my large dataset is "reasonably" normally distributed.

Is my approach correct, or is there any other alternatives?

$\endgroup$
7
  • 1
    $\begingroup$ Don't know about just looking at skewness and kurtosis. Seems the main issue is to be realistic about what closeness to normality is needed for the application at hand. $\endgroup$
    – BruceET
    Commented Jun 24, 2019 at 6:41
  • 4
    $\begingroup$ What's your motivation to check normality in the first place? Why is normality important in your application? $\endgroup$ Commented Jun 24, 2019 at 7:43
  • 1
    $\begingroup$ Shapiro, not Saphiro. Hypothesis tests of assumptions answer the wrong question (e.g. see here); when it comes to assumptions of tests, I suggest avoiding them at any sample size. $\endgroup$
    – Glen_b
    Commented Jun 24, 2019 at 8:44
  • 1
    $\begingroup$ 1. Please fix the spelling in your question as pointed out earlier. 2. Some of the answers at that other post go rather further. Indeed, I'd say that large sample sizes just make the uselessness obvious, but more generally it's not only not useful, it's actually often counterproductive (often leading you into doing exactly the wrong thing and at the same time screwing up the properties of your significance levels and p-values). $\endgroup$
    – Glen_b
    Commented Jun 25, 2019 at 1:35
  • 3
    $\begingroup$ 3. I challenge the premise of the question -- given the problems with choosing analysis on the basis of what you find in the data, automated checking doesn't strike me as being as useful as building something that's more robust to violations of anything you can't reasonably assume. $\endgroup$
    – Glen_b
    Commented Jun 25, 2019 at 1:39

3 Answers 3

8
$\begingroup$

Continuation from comment: If you are using simulated normal data from R, then you can be quite confident that what purport to be normal samples really are. So there shouldn't be 'quirks' for the Shapio-Wilk test to detect.

Checking 100,000 standard normal samples of size 1000 with the Shapiro-Wilk test, I got rejections just about 5% of the time, which is what one would expect from a test at the 5% level.

set.seed(2019)
pv = replicate( 10^5, shapiro.test(rnorm(1000))$p.val )
mean(pv <= .05)
[1] 0.05009

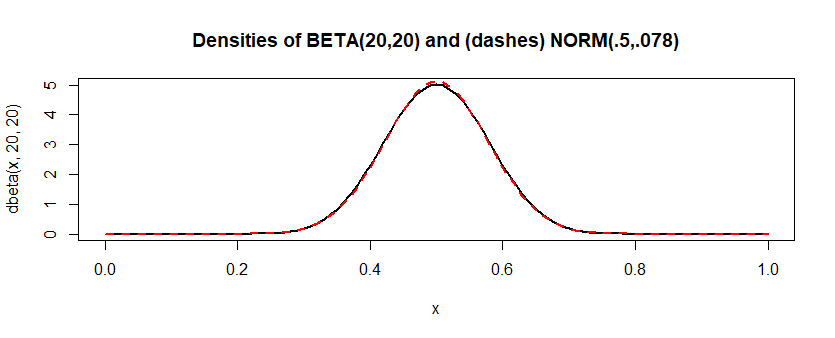
Addendum. By contrast, the distribution $\mathsf{Beta}(20,20)$ "looks" very much like a normal distribution, but isn't exactly normal. If I do the same simulation for this approximate model, Shapiro-Wilk rejects about 7% of the time. Looked at from the perspective of power, that's not great. But it seems Shapiro-Wilk is sometimes able to detect that the data aren't exactly normal.

This is a long way from "always," but I think $\mathsf{Beta}(20,20)$ is closer to normal than a lot of real-life "normal" data are. (And the link says always may be "a bit strongly stated." I suspect the greatest trouble may come with samples a lot bigger than 1000, and for some normal approximations that are quite useful--even if imperfect.) "Not every statistically significant difference is a difference of practical importance." Sometimes, people who should know better seem to forget that when doing goodness-of-fit tests.

set.seed(2019)
pv = replicate( 10^5, shapiro.test(rbeta(1000, 20,20))$p.val )
mean(pv <= .05)
[1] 0.07152

enter image description here

$\endgroup$
5
  • 3
    $\begingroup$ you get that value because the 100,000 random samples you randomly generated are based on "perfect" normal distribution. If there is any extra noise to the random samples you generated, saphiro-wilk test will always reject the null, as shown in here. And this is very relative to the real-life applications since no populations are perfectly normal $\endgroup$
    – Eric Kim
    Commented Jun 24, 2019 at 6:04
  • 1
    $\begingroup$ so, going back to the original question, how do I detect normal-enough nature of the distribution, even if its not perfectly normal? What method should I use to automate detecting near-normality without visually inspecting it? $\endgroup$
    – Eric Kim
    Commented Jun 24, 2019 at 14:04
  • $\begingroup$ First, you'd need to decide in quantitative terms what 'normal enough means. One idea. The $D$ stat in 1-sample Kolmogorov-Smirnov test is max dif btw empirical CDF of the sample and CDF of normal. According to a fixed standard, use small enough $D$ as criterion, regardless of P-val. You'd have to check this idea out to see if it does what you really want--once you decide what that is. $\endgroup$
    – BruceET
    Commented Jun 24, 2019 at 14:47
  • $\begingroup$ All this discussion is completely moot without a clear definition of "normal enough" or "looks like normal" or "reasonably normal". A test makes only sense if it is clear what you are testing against. Distributions are objects with infinite degrees of freedom and each test can only fix one degree of freedom. The OP needs to make up his mind what he requires from his "normal" samples and what deviations he expects or want to detect. $\endgroup$
    – g g
    Commented Jun 25, 2019 at 7:15
  • $\begingroup$ @BruceET I would use the following criteria: 1) Skewness close to 0, maybe a (-1,1) range, or that you feel more comfortable with depending on "how normal-like is normal enough". 2) Kurtosis close to 3 (or excess kurtosis close to 0) High kurtosis is often a greater issue than low kurtosis as it leads to more outliers $\endgroup$
    – David
    Commented Jun 25, 2019 at 8:07
2
$\begingroup$

As @gg pointed out in a comment, this entire discussion in pointless without defining how normal-like does data have to be for us to consider it "normal enough". In practice, I often like the following criteria:

  • Skewness close to 0, maybe a (-1,1) range, or that you feel more comfortable with depending on "how normal-like is normal enough".
  • Kurtosis close to 3 (or excess kurtosis close to 0) High kurtosis is often a greater issue than low kurtosis as it leads to more outliers.
  • Median not far away from the mean
  • QQ-plots are your friends!
$\endgroup$
1
  • $\begingroup$ Albeit, high kurtosis (counterintuitively) tends to lead to conservative tests, and low kurtosis to higher false positives (since variances tend to be overestimated in the former and underestimated in the latter). $\endgroup$
    – justme
    Commented May 7, 2020 at 12:02
0
$\begingroup$

...However, if the sample size is very large, the test is extremely "accurate" but practically useless because the confidence interval is too small. They will always reject the null, even if the distribution is reasonably normal enough...

What if you take a sub-sample of size 100 or 300 from the large sample consisting of several thousands or more. If I'm not mistaken then taking the sub-samples will reflect the same distribution but will work better with the common normality tests.

$\endgroup$
6
  • $\begingroup$ Welcome to the site. Was this intended as an answer to the OP's question, a comment requesting clarification from the OP or one of the answerers, or a new question of your own? Please only use the "Your Answer" field to provide answers to the original question. You will be able to comment anywhere when your reputation is >50. If you have a new question, click the blue ASK QUESTION at the top of the page & ask it there, then we can help you properly. Since you're new here, you may want to take our tour, which has information for new users. $\endgroup$ Commented Nov 20, 2020 at 17:50
  • $\begingroup$ It was intended as an answer. $\endgroup$
    – horv77
    Commented Nov 20, 2020 at 17:57
  • 1
    $\begingroup$ This makes no sense to me. The solution to a significance test being hopeless for very large sample sizes because everything fails is not to find a different problem where significance tests sometimes don't fail. It's better to wonder (1) how to plot and measure departure from normality rather than test for it (2) whether departure from normality matters for what else you intend to do. $\endgroup$
    – Nick Cox
    Commented Nov 20, 2020 at 18:54
  • 1
    $\begingroup$ Taking this advice to its logical conclusion -- since there's no basis for choosing 300 or 100 or even fewer elements in the subsample -- we might as well choose the minimum of 2, in which case any normality test will fail to reject the hypothesis. If your objective is not to reject the hypothesis (as suggested by the question), then I suppose in that sense this "works better!" $\endgroup$
    – whuber
    Commented Nov 20, 2020 at 23:36
  • 1
    $\begingroup$ Than what if a normal curve is fit on the histogram of the data with the same mean and sd and then sum the squared vertical differences and test a limit then? There would need to be a sophisticated method to try and find the best bin size for the histogram of the data as well. $\endgroup$
    – horv77
    Commented Dec 5, 2020 at 8:49

Your Answer

By clicking “Post Your Answer”, you agree to our terms of service and acknowledge you have read our privacy policy.

Not the answer you're looking for? Browse other questions tagged or ask your own question.