3
$\begingroup$

I am trying to model y, a continuous variable that only takes positive values with fixed and random effects.

This is my first approach, using lmer():

log(y) ~ x1 + x2 + x3 + (1|plot) + (1|id)

The fit is not perfect but the residuals look roughly OK I guess.

In my second approach I am using glmer():

y ~ x1 + x2 + x3 + (1|plot) + (1|id)

with family = Gamma(link = "inverse")

The fit gets a bit better. But I am unsure if using the much more complex glmer is justified or if I should stick to lmer? On what grounds should I decide with which model to go?

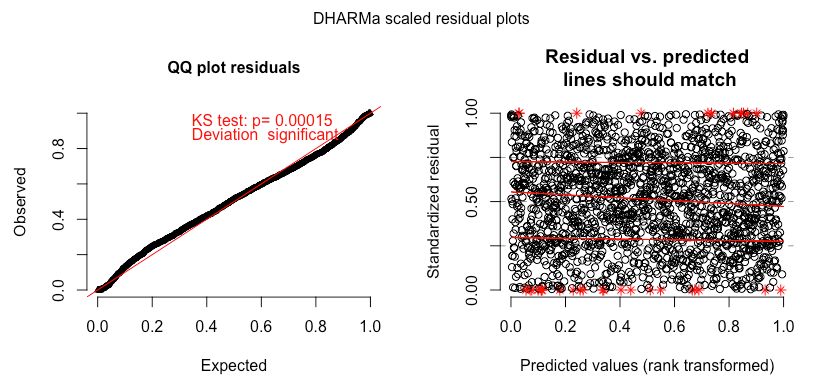
Edit Simulated Residuals for the GLMM: enter image description here

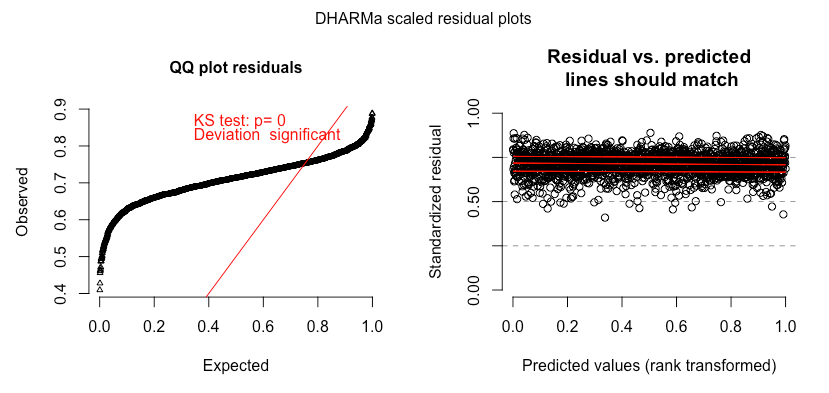
Simulated Residuals for the LMM: enter image description here

$\endgroup$
7
  • 5
    $\begingroup$ I think we need to know more about the problem. What is it you are modelling? $\endgroup$ Commented Jun 26, 2019 at 16:06
  • $\begingroup$ I am modelling an indicator for plant growth, which is calculated as a ratio of two measurements. $\endgroup$
    – user34927
    Commented Jun 26, 2019 at 16:11
  • 5
    $\begingroup$ Ratios can be tricky and sometimes are better with the numerator and denominator modeled separately. Following up on the comment from @DemetriPananos, please say more about the data that contribute to calculating that ratio. Note that both models above show much lower fitted than observed values at the higher values, and the cloud of indistinguishable points seems correspondingly to have a slope much lower than 1. A standard plot of residuals against fitted values would be more informative. A normal distribution of errors doesn't help much if the basic fit isn't good. $\endgroup$
    – EdM
    Commented Jun 26, 2019 at 16:39
  • $\begingroup$ @EdM I have added the plot of residuals against fitted values. $\endgroup$
    – user34927
    Commented Jun 27, 2019 at 5:18
  • $\begingroup$ First of all, what is the goal of your modeling ? Predictive or Explanatory ? Do you want your coefficient estimates to make sense or just having the better prediction ? When you have that, you will have to select the criteria: either some error criteria for predictive or criteria like AIC, BIC, p-value, etc. for explanatory. After that, you can answer your question properly, you choose the model that minimize your chosen criteria. $\endgroup$ Commented Jul 2, 2019 at 0:38

1 Answer 1

3
+50
$\begingroup$

You can better evaluate the fit of the two models using the simulated residuals calculated by the DHARMa package. Irrespective of the type of the model, these simulated residuals will exhibit a flat/uniform distribution for a correctly specified model.

However, you need to be careful with their use if you have missing at random missing data in your outcome variable y; for more on this check here.

$\endgroup$
5
  • $\begingroup$ Thanks, I'll give it a try. I am still confused though - do I aim for "better" residuals or better fit (as EdM pointed out above if I understood correctly)? $\endgroup$
    – user34927
    Commented Jul 4, 2019 at 14:42
  • $\begingroup$ I added the plots of the simulated residuals.. $\endgroup$
    – user34927
    Commented Jul 4, 2019 at 15:19
  • $\begingroup$ The plots suggest that the log-normal model provides a better fit to the data than the Gamma model. $\endgroup$ Commented Jul 4, 2019 at 16:41
  • $\begingroup$ But still the GLMM predicts the higher values (> 2) better than the LMM, I feel like that should not be ignored..? $\endgroup$
    – user34927
    Commented Jul 4, 2019 at 16:55
  • $\begingroup$ I would suggest validating this using a similar procedure as the one behind the simulated residuals, i.e., compare the observed distribution of the data for values >2 with the distribution of simulated values from the models in the same range. For an example illustrating this see the plot at the end of this section: drizopoulos.github.io/GLMMadaptive/articles/… $\endgroup$ Commented Jul 4, 2019 at 17:26

Your Answer

By clicking “Post Your Answer”, you agree to our terms of service and acknowledge you have read our privacy policy.