1
$\begingroup$

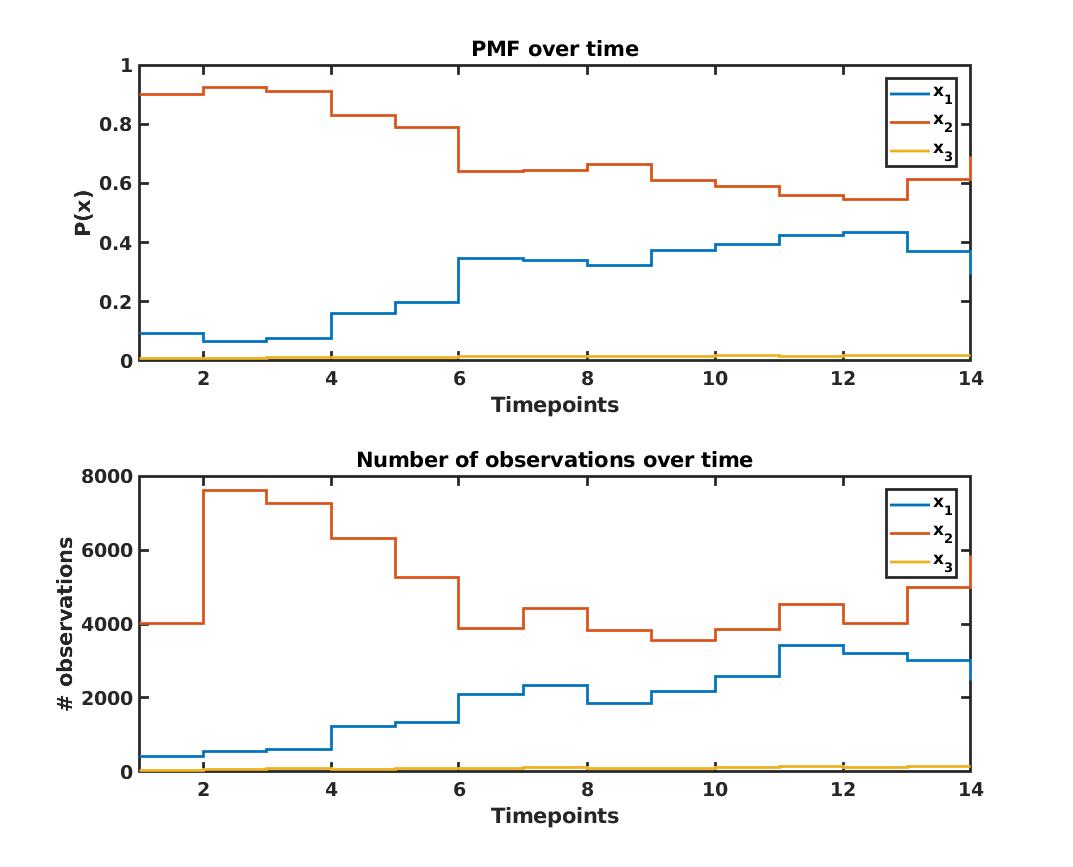
Consider a discrete random variable $X$ with three possible realizations $x_1,x_2,x_3$. This variable is observed over time, with the number of observations per point in time varying.

The top figure below shows the probability for the three realizations for each point in time, with the bottom plot showing how frequently each realization has been observed at each timepoint.

Let's assume we observe $X$ at the timepoints 1 to 5 and want to make predictions for the probability of each realization. A simple prediction would of course be just predicting the same probabilities as observed at the most recent time point, 5 in this case, but this would ignore that the probability of $x_1$ has been increasing and that of $x_2$ decreasing over time.
What would be a better approach to predicting these future probabilities?

Since the prediction needs to consider that the predicted values must lie within $(0,1)$ and also sum to 1, my first ideas were

  1. Approaching this as a problem, applying a transformation like the isometric log-ratio transformation and then solving a multivariate regression problem

  2. Employing Dirichlet Regression

Am I missing other approaches to this problem? What would be the most reasonable way to make predictions in this case?

enter image description here

$\endgroup$

1 Answer 1

0
$\begingroup$

First of all, I am not even sure whether you can make predictions with an unobserved region (at least, that was I learned, but statistics was never among my strengths).

I have been struggling with a similar problem for some time trying to find the best approach for my 21 dimensional compositional data. I tried both ILR-transform and Dirichlet regression, and although I am no expert, my general impressions are the following:

ILR-transform: Solves your problem simply...I thought first. You just have to input your variables and it will create new ones for "commercial regression". However I creates another one as you can hardly interpret your new variables in terms of the original ones (So far, I have not managed to find a good method for it). In your case (3 dimensions), you will get two new variables, with no co-linearity)

Dirichlet regression: It was much harder to understand (I still do not understand), because, I had to actually understand how it models stuff, but at least your variables will remain intact. On the other hand it gets gruesome with higher dimensions (and multiple independent variables), because you only get the effect on the "alphas" of the Dirichlet distribution, which is one step away from the actual distribution.

However, with a composition of only three variables, and one simple independent variable (time) it is still easy to visualize the behavior of the actual distribution through time, with nice examples see DirichletReg. In your case, this might be easier to interpret.

$\endgroup$
1
  • 1
    $\begingroup$ I don't think this answers the question. $\endgroup$ Commented Sep 3, 2019 at 15:37

Your Answer

By clicking “Post Your Answer”, you agree to our terms of service and acknowledge you have read our privacy policy.

Not the answer you're looking for? Browse other questions tagged or ask your own question.