How to calculate AUC, if I have values of sensitivity and specificity for various threshold cutoffs?
I have sensitivity and specificity values for 100 thresholds.
sensitivity: c(0.649193548387097, 0.649193548387097, 0.649193548387097, 0.649193548387097,
0.649193548387097, 0.649193548387097, 0.649193548387097, 0.646586345381526,
0.646586345381526, 0.646586345381526, 0.646586345381526, 0.646586345381526,
0.646586345381526, 0.646586345381526, 0.646586345381526, 0.646586345381526,
0.644, 0.644, 0.644, 0.644, 0.641434262948207, 0.641434262948207,
0.638888888888889, 0.638888888888889, 0.638888888888889, 0.634920634920635,
0.634920634920635, 0.634920634920635, 0.634920634920635, 0.630952380952381,
0.628458498023715, 0.624505928853755, 0.620553359683794, 0.615686274509804,
0.611764705882353, 0.607843137254902, 0.607843137254902, 0.6,
0.6, 0.59765625, 0.59375, 0.5859375, 0.58203125, 0.57421875,
0.57421875, 0.56640625, 0.562015503875969, 0.550387596899225,
0.534883720930233, 0.511627906976744, 0.5, 0.496153846153846,
0.486590038314176, 0.478927203065134, 0.46360153256705, 0.455938697318008,
0.452107279693487, 0.442748091603053, 0.425855513307985, 0.418250950570342,
0.4106463878327, 0.399239543726236, 0.390151515151515, 0.382575757575758,
0.377358490566038, 0.369811320754717, 0.362264150943396, 0.354716981132075,
0.343396226415094, 0.343396226415094, 0.339622641509434, 0.328301886792453,
0.316981132075472, 0.29811320754717, 0.294339622641509, 0.286792452830189,
0.279245283018868, 0.270676691729323, 0.255639097744361, 0.244360902255639,
0.236842105263158, 0.236842105263158, 0.229323308270677, 0.225563909774436,
0.214285714285714, 0.191729323308271, 0.184210526315789, 0.176691729323308,
0.165413533834586, 0.139097744360902, 0.139097744360902, 0.12781954887218,
0.120300751879699, 0.105263157894737, 0.075187969924812, 0.0639097744360902,
0.0601503759398496, 0.0526315789473684, 0.0413533834586466, 0.018796992481203,
0)
specificity : c(0.917961165048544, 0.920581113801453, 0.923708353452438, 0.925337186897881,
0.928743379874819, 0.930288461538462, 0.93371757925072, 0.934772182254197,
0.936272160996646, 0.937739463601533, 0.938872970391595, 0.940867906533143,
0.942435775451951, 0.944893111638955, 0.946969696969697, 0.949881796690307,
0.952290977798772, 0.953235710911667, 0.955209806694955, 0.956235294117647,
0.95815702867889, 0.95868544600939, 0.961556493202063, 0.962043111527648,
0.963951310861423, 0.965420560747664, 0.966449207828518, 0.966930600838379,
0.9674569967457, 0.967951695308871, 0.967951695308871, 0.968474733426055,
0.969401947148818, 0.969401947148818, 0.969907407407407, 0.971322849213691,
0.972735674676525, 0.973684210526316, 0.97372060857538, 0.973756906077348,
0.975598526703499, 0.977000919963201, 0.977512620468105, 0.9780119102153,
0.979405034324943, 0.981235697940503, 0.98124428179323, 0.982167352537723,
0.982632541133455, 0.982648401826484, 0.983135824977211, 0.984069185252617,
0.984993178717599, 0.985467756584923, 0.985934664246824, 0.986406887177164,
0.98733604703754, 0.98869801084991, 0.98961625282167, 0.989625620207488,
0.990081154192967, 0.990085624155025, 0.990540540540541, 0.990540540540541,
0.990995047276002, 0.991449144914491, 0.991899189918992, 0.993252361673414,
0.99370220422852, 0.993707865168539, 0.993713515940727, 0.994616419919246,
0.995513683266039, 0.996410946612831, 0.996859578286227, 0.996860986547085,
0.997311827956989, 0.997315436241611, 0.997316636851521, 0.997763864042934,
0.997763864042934, 0.998211890925346, 0.998212689901698, 0.998212689901698,
0.998212689901698, 0.998214285714286, 0.998661311914324, 0.998661311914324,
0.998661311914324, 0.999107939339875, 0.999107939339875, 0.999108337048596,
0.999108337048596, 0.999108734402852, 0.999109528049866, 0.999554962171785,
1, 1, 1, 1, 1)
threshold:
c(0, 0.01, 0.02, 0.03, 0.04, 0.05, 0.06, 0.07, 0.08, 0.09, 0.1,
0.11, 0.12, 0.13, 0.14, 0.15, 0.16, 0.17, 0.18, 0.19, 0.2, 0.21,
0.22, 0.23, 0.24, 0.25, 0.26, 0.27, 0.28, 0.29, 0.3, 0.31, 0.32,
0.33, 0.34, 0.35, 0.36, 0.37, 0.38, 0.39, 0.4, 0.41, 0.42, 0.43,
0.44, 0.45, 0.46, 0.47, 0.48, 0.49, 0.5, 0.51, 0.52, 0.53, 0.54,
0.55, 0.56, 0.57, 0.58, 0.59, 0.6, 0.61, 0.62, 0.63, 0.64, 0.65,
0.66, 0.67, 0.68, 0.69, 0.7, 0.71, 0.72, 0.73, 0.74, 0.75, 0.76,
0.77, 0.78, 0.79, 0.8, 0.81, 0.82, 0.83, 0.84, 0.85, 0.86, 0.87,
0.88, 0.89, 0.9, 0.91, 0.92, 0.93, 0.94, 0.95, 0.96, 0.97, 0.98,
0.99, 1)
AUC =round(sum(specificity [1:length(threshold)]*diff(c(0, 1 - sensitivity [1:length(threshold)]))),2)
AUC= 0.95
1)Is this the correct way to find AUC?
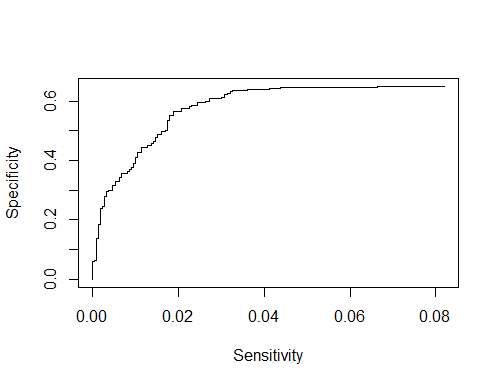
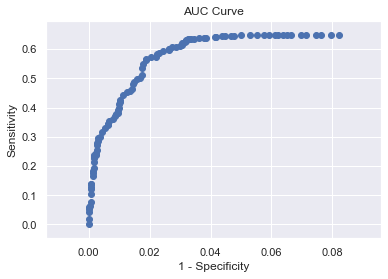
2)If I want to plot ROC curve is this code fine?
plot((1-specificity),sensitivity ,xlab = "Sensitivity",ylab = "Specificity",type = "l")
3) Is there some formula to calculate the power of this ROC analysis. So that I know I need minimum samples to calculate AUC?

