2
$\begingroup$

I performed an ANOVA test on some data from samples and obtained a very small p-value in the order of e-200. My samples size are not big (12) wand I'm using 30 samples. Samples are not related at all between each other.

from this question: How should tiny $p$-values be reported? (and why does R put a minimum on 2.22e-16?)
I read that a tiny p-value as small as this should be reported as p<0.001. However, I'm not sure if there is anything wrong to have such a small values.

my questions are: 1. Is it ANOVA not suitable for my samples? (I'd like to test if my data is statistically different). 2. I'm getting this small p-value because I have not enough data? If yes, what other statistically method should I use?

Thanks,

PD: Aplogies in advance because I can't add a comment on any post (I'm a new user)

$\endgroup$
1
  • 1
    $\begingroup$ Thanks to everyone. My mistake was to perform ANOVA in non-normal data. Unfortunately, my statistiscal knowledge is almost null and I need to somehow verify my data. what test should be suitable to run in my data? I'm growing cells in miroarrays and mesauring the deflection of this arrays caused by cell migration. My data is displacement vs time, I check all my data and it's non-normal. Displacement of each pillar has no influence with the neighbour pillar. $\endgroup$
    – Ivan
    Commented Sep 14, 2019 at 10:26

3 Answers 3

2
$\begingroup$

I see two possibilities:

  1. You made a mistake.

  2. You have emphatic evidence against the null hypothesis. Congratulations!

How to report it will depend on your field and the particular journal where you want to submit your findings. If the journal format says to report tiny p-values as $p<0.001$, then do it that way.

Answering your questions:

  1. ANOVA tests if many populations have the same mean. If this is what you want to explore, then ANOVA is a reasonable method to consider. ANOVA does have some assumptions that you'll want to check.

  2. We don't usually think of small p-values happening because of too little data. For instance, if you flip a coin ten times and get 6 heads and 4 tails, you won't be particularly convinced that the coin is biased towards heads. If you flip the coin 10,000 times and get 6,000 heads and 4,000 tails, you have stronger evidence of a biased coin. What could happen with a small sample size is that you don't cushion against fluke values (such as an "outlier" skewing the mean of a few numbers, while including many numbers will help lessen the impact of that "outlier").

$\endgroup$
5
  • $\begingroup$ My mistake was to perform ANOVA in non-normal data. Unfortunately, my statistiscal knowledge is almost null and I need to somehow verify my data. what test should be suitable to run in my data? I'm growing cells in miroarrays and mesauring the deflection of this arrays caused by cell migration. My data is displacement vs time, I check all my data and it's non-normal. Displacement of each pillar has no influence with the neighbour pillar. would kruskal wallis test be suitable? $\endgroup$
    – Ivan
    Commented Sep 14, 2019 at 20:35
  • $\begingroup$ @Ivan Meaning that your data of interest are the displacement vs time relationships produced by the microarray experiments? $\endgroup$
    – Dave
    Commented Sep 14, 2019 at 21:39
  • $\begingroup$ yes, displacement(micrometers) vs time relationships(seconds) $\endgroup$
    – Ivan
    Commented Sep 15, 2019 at 12:38
  • $\begingroup$ @Ivan Then ANOVA isn’t what you want. You’re variable of interest has two dimensions, and ANOVA only operates on one variable. MANOVA (multivariate ANOVA) could be an option, though it will depend on what you want to test. I have my doubts that you’re truly just interested in means. What is your research question? If what interests you is if the relationship between the two variables is different in each microarray, MANOVA is not the statistical test for you. $\endgroup$
    – Dave
    Commented Sep 15, 2019 at 14:00
  • $\begingroup$ regarding the variables,I think i misuderstood your question (sorry about that). basically i have a video and I'm measuring the deflection of each microarray in every second.I think this make my variable of interest one dimensional. About ANOVA, I think it requires normality and my samples are not normal. Also each microarray is independant from the neighbour (independant samples). my research question will be if cells are able to deflect the microarrays.I havevcontrol samples and I think by comparing samples and control means, I can succeed to prove that my microarrays are working. $\endgroup$
    – Ivan
    Commented Sep 15, 2019 at 18:08
2
$\begingroup$

I generally agree with the other two answers here (+1 to both), but would like to add further cautions.

When you calculate a p-value, it's important to remember that that is conditional on a set of assumptions. When I see any p-value that low - even with larger sample sizes - I'm more likely to infer that the assumptions are not met than that the p-value is accurate. Dave & BruceET discuss how 'well-behaved' the data is, which relates to one such assumption. But there are many possibilities: the data could be fake, the measuring instrument could have failed, the data could be transcribed incorrectly, the analysis may be p-hacked, the distributions could be non-normal...heck even cosmic rays causing a relevant bit to flip is probably more likely. This is not to say that any of these things have happened here, or that they are less likely if the p-value is higher. But their probability is high relative to e-200, which makes that value suspect to me.

Additionally, it's worth considering what information p-values actually provide you with. They are a tool, but a weak one and susceptible to misuse and misinterpretation. What is your goal? Are you just trying to say that two groups are different? If so, simply plotting your data points is likely to convince people if the p-value is actually reflective of huge differences. If not, consider whether your analysis could be reoriented towards what you are actually interested in (the magnitude of the differences, for example).

$\endgroup$
1
$\begingroup$

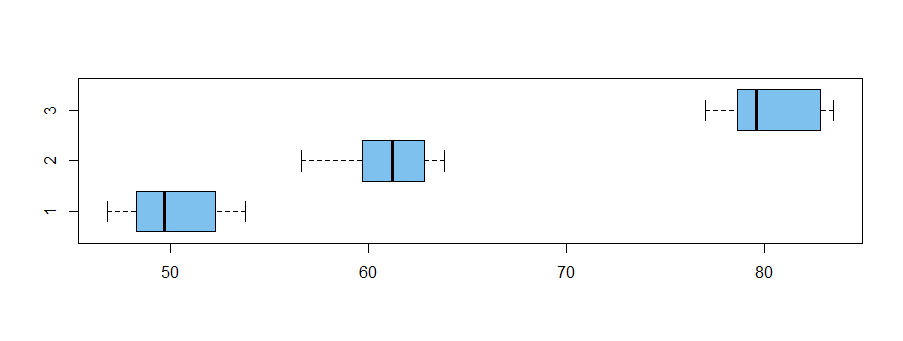
Comment. Here are fake normal data with roughly equal sample variances for a one-factor ANOVA with three levels of the factor, in which the P-value is as small as R reports. If your data has groups as distinctly different and 'well-behaved' as these, then it seems that Option 2 in @Dave's Answer (+1) applies.

Otherwise, or if you have doubts whether you are doing the analysis correctly, please say how many groups you have and the means and standard deviations within each group.

set.seed(912)
x1 = rnorm(12, 50, 2);  x2 = rnorm(12, 60, 2);  x3 = rnorm(12, 80, 2)

summary(x1); sd(x1)
   Min. 1st Qu.  Median    Mean 3rd Qu.    Max. 
  46.85   48.35   49.73   50.16   51.90   53.80 
[1] 2.353213
summary(x2); sd(x2)
   Min. 1st Qu.  Median    Mean 3rd Qu.    Max. 
  56.63   59.74   61.21   60.99   62.82   63.83 
[1] 2.187836
summary(x3); sd(x3)
   Min. 1st Qu.  Median    Mean 3rd Qu.    Max. 
  77.04   78.83   79.59   80.27   82.66   83.50 
[1] 2.291486

x = c(x1, x2, x3);  g = as.factor(rep(1:3, each=12))
boxplot(x ~ g, horizontal=T, col="skyblue2")

enter image description here

anova(lm(x ~ g))
Analysis of Variance Table

Response: x
          Df Sum Sq Mean Sq F value    Pr(>F)     
g          2 5581.2 2790.60  537.51 < 2.2e-16 ***
Residuals 33  171.3    5.19                      
---
Signif. codes:  0 ‘***’ 0.001 ‘**’ 0.01 ‘*’ 0.05 ‘.’ 0.1 ‘ ’ 1
$\endgroup$

Your Answer

By clicking “Post Your Answer”, you agree to our terms of service and acknowledge you have read our privacy policy.

Not the answer you're looking for? Browse other questions tagged or ask your own question.