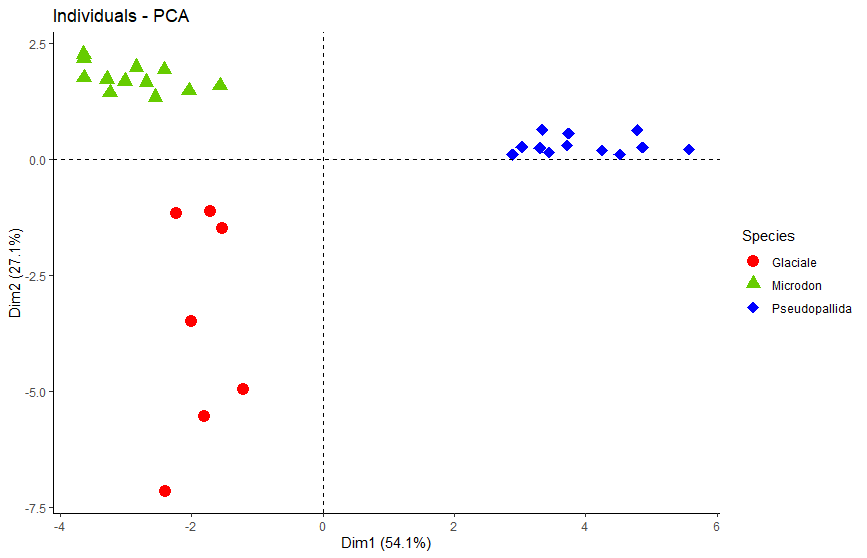
I am studying the feeding behaviour of deep sea fishes, and have produced a dataset containing percentages for 20 different fatty acids (totalling 100%) for 32 individual fish. I have performed PCA (see below) and the data seems to group into 3 distinct groups, which correlates to the species of fish. Now I want to test the hypothosis that there is a significant difference between the 3 groups. I tried performing a MANOVA, but discovered in the process that my data is not normally distributed:
Shapiro-Wilk normality test data: norm_test W = 0.62718, p-value < 2.2e-16
So, now I hope some of you can give your recommendations as to which test/tests to perform to determine whether the groups are significantly different or not. I would also appreciate suggestions to how to present my results, and additional work I can pursue to maximize the information contained in the data.
Here is an example of what my dataset looks like:
Thank you for your time!
/Kristian


