2
$\begingroup$

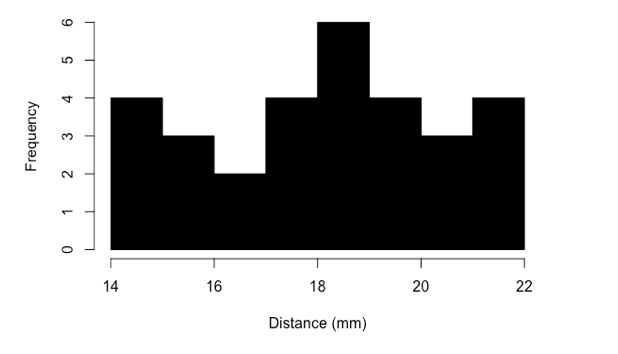
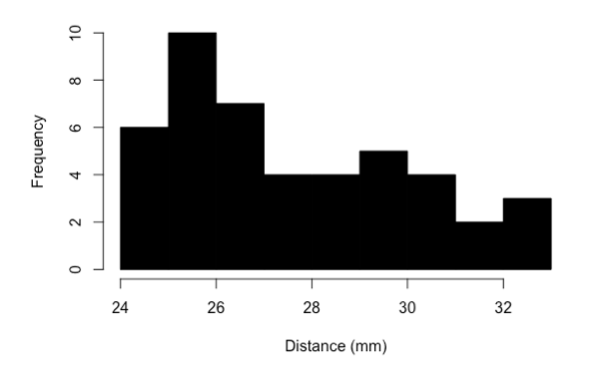
I'm comparing two groups of data. One group has a sample size of 30, and the other a sample size of 45. The second group is not normally distributed, and thus this violates the normality assumption. Then, I reasoned that I should use a non-parametric test -- the Mann-Whitney test. However, the two groups don't seem to have sufficiently similar distributions (pictures attached)? I would love some opinions on what test would be good to use here between the two.

Thanks.

enter image description here enter image description here

$\endgroup$
2
  • 1
    $\begingroup$ How did you determine that one sample might come from a normal distribution & the other could not? Is it just based on the histograms? Neither sample size is very large. There is a similar issue about the similarity between the two distribution when considering the Wilcoxon- Mann-Whitney test. $\endgroup$ Commented Oct 13, 2019 at 21:45
  • $\begingroup$ I used a Shapiro-Wilk test. I also tried to log transform the data, but didn't help $\endgroup$
    – Hana
    Commented Oct 13, 2019 at 22:41

2 Answers 2

2
$\begingroup$
  1. A relevant factor in the choice of test is your specific hypotheses, which is unstated. You should clarify.

  2. Failure to reject normality doesn't mean you have normality. Rejecting normality also doesn't mean that you will have trouble using the test. There are a number of posts on site that suggest that formally testing that assumption may not be a productive approach. [e.g. see this one; I find Harvey's post particularly to the point. I make some related comments here)

Neither of those histograms look close to normal (though you have to be cautious about histograms with few bins).

On the other hand, if your samples are indicative of the population distributions, the histograms suggest that a t-test would probably do just fine. If you're concerned about the significance level potentially being higher than selected (as you can get when the distributions may be close to uniform) you could consider a permutation test of means (or even of the t-statistic itself).

  1. There's no requirement that the two populations have the same shape for a Wilcoxon-Mann-Whitney test. It's an assumption under the null hypothesis (specifically, you require exchangability under the null), but there's nothing to suggest the null is actually true, so a hint of slightly differing shapes under what's almost certainly the alternative may be of no consequence unless you're assuming a pure-shift alternative; there's no absolute need to have that be so under either test you mention. Given the small samples, even an assumption of the same shapes for a pure shift-alternative would seem reasonably tenable.

  2. I suggest you get out of the habit of choosing your tests based on the appearance of the samples you want to test; better to rely on external information (other data on these or similar variables, such as other studies or pilot samples, etc) and your understanding (or that of subject matter experts) of the variables. Then consider what you're prepared to assume as a reasonable approximation. It's possible to examine what the effect of the assumptions failing to hold might be, if you have an idea of the manner and size of the deviation from the assumptions.

While you've no doubt been taught to test your distributional assumptions, this practice has consequences for the properties of your test procedures, and they're not particularly helpful.

Either test will probably perform adequately, but if you're interested in whether the mean changed, personally I'd be inclined to just do a t-test in this instance; there's no hint of more than very mild skewness, no heavy tails. If I felt unsure I might use the t-statistic in a permutation test, but I think it will make little difference.

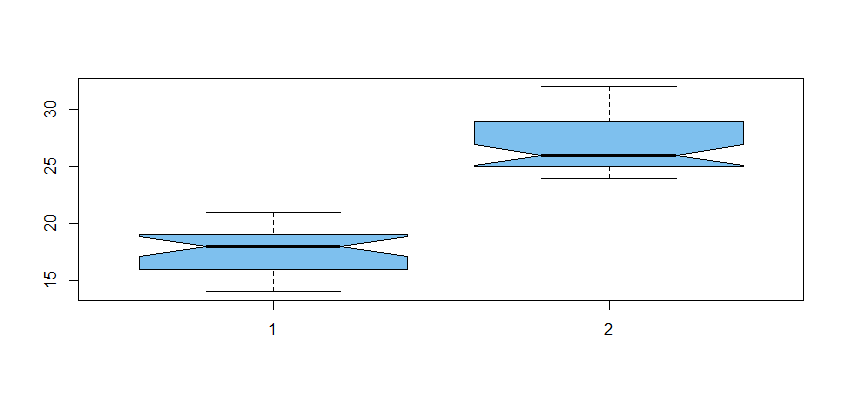
Given the complete lack of overlap, any location test you use will reject at any reasonable significance level. Indeed the p-value will be extremely tiny. Which is to say there's little point in a formal test anyway -- they're obviously very different. Even a relatively low power test like a Tukey-Duckworth Quick test would reject at a small significance level.

$\endgroup$
1
$\begingroup$

I see nothing wrong with either a Welch two-sample t test or a Wilcoxon rank sum test. However, it is worthwhile noticing that there is complete separation between the two samples, so a 2-sided permutation test has P-value $2/{75 \choose 45} =$ 2.56e-21.

2/choose(75,30)
[1] 2.557939e-21

Digitizing the histograms as integer values:

x = rep(14:21, times=c(4,3,2,4,6,4,3,4))
y = rep(24:32, times=c(6,10,7,4,4,5,4,2,3))
boxplot(x,y, col="skyblue2", notch=T)

enter image description here

t.test(x,y)$p.val
[1] 9.560777e-26
wilcox.test(x,y)$p.val
[1] 2.571197e-13
 Warning message:
 In wilcox.test.default(x, y) : 
  cannot compute exact p-value with ties
$\endgroup$

Your Answer

By clicking “Post Your Answer”, you agree to our terms of service and acknowledge you have read our privacy policy.

Not the answer you're looking for? Browse other questions tagged or ask your own question.