2
$\begingroup$

I am calculating the correlations between vectors of experimental data by a variety of methods (Pearson's, cosine similarity, Euclidian distance, etc.). Most the results look fine, but occasionally the cosine similarity will seem extremely inflated.

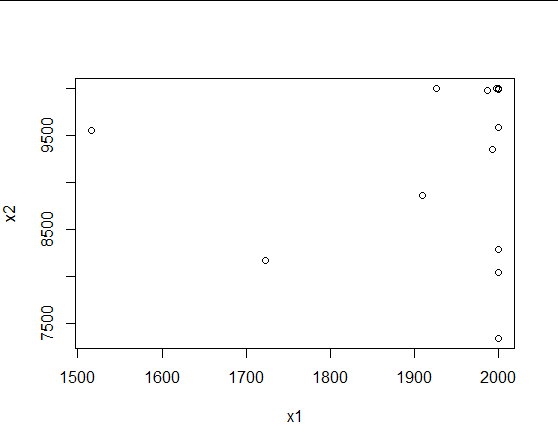
For example, these two vectors don't appear to be correlated. The Pearson's correlation coefficient is 0.16 (this makes sense). The cosine similarity is 0.995. Why is it so high?

# two vectors
x1 <- c(2000,2000,2000,1987.5,2000,2000,2000,1910,1926.66666666667,2000,1723.33333333333,2000,2000,1992.5,2000,2000,2000,1997.5,2000,1516.66666666667)
x2 <- c(10000,8045,10000,9985,10000,10000,10000,8866.66666666667,10000,8285,8173.33333333333,10000,9590,9355,10000,10000,9990,10000,7345,9557.5)

# visually, they seem mostly uncorrelated
plot(x1, x2)

# Pearson's correlation coefficient is 0.16 (this makes sense)
cor(x1, x2)

# The cosine similarity is 0.995.  Why?
cossim <- function(A, B) sum(A*B) / ( sqrt(sum(A^2)) * sqrt(sum(B^2)) )  # cosine similarity
cossim(x1, x2)

enter image description here

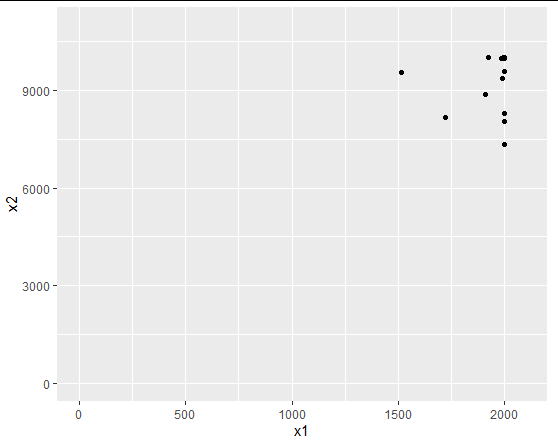
Edit: by request, I added an image that includes the origin in the axes scales. I guess I understand the motivation for this, but I still don't see why this is a 0.995. I would imagine that the vectors are more than 0.005 "different." enter image description here
$\endgroup$
4
  • $\begingroup$ Please include a plot of your data with the origin at x1=0 and x2=0. That might help explain your result and allow you to post an answer to your own question. $\endgroup$
    – EdM
    Commented Nov 4, 2019 at 16:25
  • 4
    $\begingroup$ The answer might become obvious if you were actually to draw these points as vectors, for then you would include the origin $(0,0)$ in the plot, forcing you to see how they are all closely clustered in a common direction. The correlation doesn't account for the origin at all: it adopts its own origin (the point of mean values). $\endgroup$
    – whuber
    Commented Nov 4, 2019 at 17:06
  • 3
    $\begingroup$ Re the edit: your code indicates there are 21 points, whereas the plots show only 10 or 11 distinct locations. Evidently a majority of the points are virtually identical, leading to very high similarity, but your plotting method does not reveal that. Your intuition would be helped by choosing a more accurate visualization. (Jittering would be a good choice.) $\endgroup$
    – whuber
    Commented Nov 4, 2019 at 18:15
  • $\begingroup$ Thanks for the useful comments so far. I guess I didn't appreciate the importance of the (0,0) point which is created by the lack of mean-centering (as in Pearson). If there is no special importance of (0,0) for a particular vector, does that mean that cosine similarity is inappropriate? For example, some of my experimental results are the log of a physical quantify, and (0,0) doesn't have a significant meaning in log space. $\endgroup$
    – Arthur
    Commented Nov 4, 2019 at 20:29

1 Answer 1

2
$\begingroup$

Your last comment essentially provides the answer to your original question: the (0,0) point is critically important for cosine similarity.

Following up on a comment from @whuber, it looks like about 10 of your 21 data points--nearly half--are coincident at (2000,10000). His point about jittering the data to see what hides in the original plot is well taken. In terms of the angle with respect to the origin, that highly over-represented value corresponds to an angle of 78.7 degrees. As he implies in another comment, actually drawing the vectors would show angles very close to that value for all but about 4 or 5 of your points. Even your extreme cases (in terms of angles) only represent about 75 degrees and 81 degrees. So a very high cosine similarity is what you found when you did the calculation.

To answer the question in your last comment: cosine similarity might not always be the best choice for assessing similarity of vectors. You have to think about the nature of the data and just which type of similarity you really care about, based on your knowledge of the subject matter.

$\endgroup$
2
  • $\begingroup$ "actually drawing the vectors would show angles very close", but how to draw vectors in this high dimensional space? $\endgroup$
    – mox
    Commented Jan 24 at 8:36
  • $\begingroup$ please check this question: bioinformatics.stackexchange.com/questions/22085/… maybe you can answer $\endgroup$
    – mox
    Commented Jan 24 at 8:59

Your Answer

By clicking “Post Your Answer”, you agree to our terms of service and acknowledge you have read our privacy policy.

Not the answer you're looking for? Browse other questions tagged or ask your own question.