0
$\begingroup$

I need some advice on performing statistical tests on financial ratios and highly skewed data. I have gathered a large sample of several financial ratios for two groups. The sample size is + 40,000 (10yr period) for each ratio. As is known in literature, the distribution of most financial ratios is highly skewed and doesn’t follow a normal distribution. To a large degree this is caused by outliers (and partly due to non-negative values). Take i.e. the market to book ratio. If the denominator approaches to zero the ratio get extremely large. In my case the max value is +8.000 (S&P Industry average is 2.54 for the same period). Though mathematically correct, there is no economic meaning. Skewness for the distribution is 86, the median 2.06 and the mean 4.53. For some other ratios, skewness statistics reach values up to 300.

After conducting tukey’s fence (interquartile range rule) for outlier treatment, where I eliminate all values larger than the outer fence (q1 - 3.0xIQR & q3 + 3.0IQR), skewness is 1.63, the median 1.98 and the mean 2.51. I know there is a large debate on how to deal (or not deal) with outliers, but in my case I have to reduce their influence.

So, my questions are as follows:

  1. Is the outlier treatment reasonable?
  2. Can I conduct a Welch's t-test? Variances are not equal. After treating for outliers, most skewness statistics are close to -1.5 and +1.5 max is 3.5. I found that literature is mixed on that topic.
  3. Why are so many studies out there conducting t-tests on financial ratios, without reporting skewness statistics or outlier treatment, though non-normality can be assumed?
  4. Are there better ways to deal with the data?

Any help is highly appreciated. Thanks in advance!

Update: I just added two histograms. The first one uses 3*iqr rule and the second is wisorizing at the 5%,95%-percentile level. Skewness after winsorizing is 1.57, mean 2.81 and median is 2.06. So, is winsorizing in that situation the better (more scientific) option?

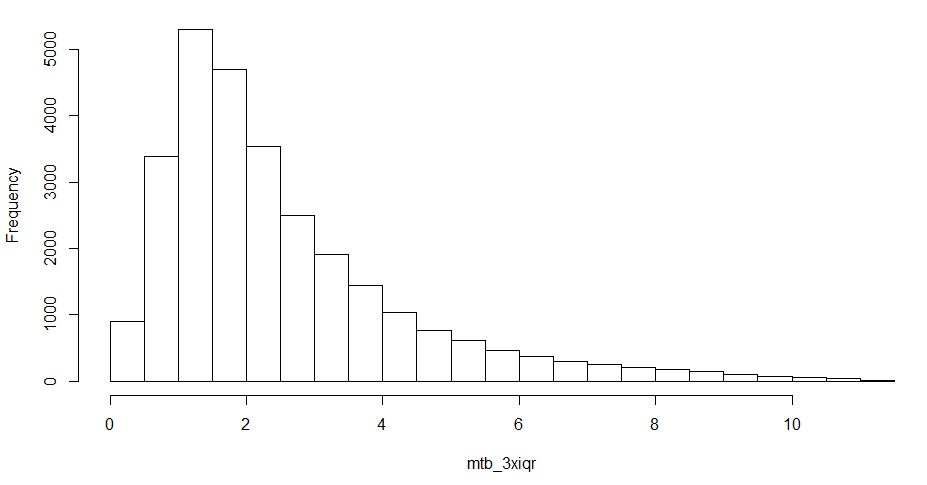
enter image description here

enter image description here

$\endgroup$
7
  • 2
    $\begingroup$ This might be an interesting experiment for you: use bootstrap to find the sampling distribution of $\bar{x}-\bar{y}$. Visualize a histogram or KDE, and view a normal QQ plot of the sampling distribution. $\endgroup$
    – Dave
    Commented Nov 15, 2019 at 18:08
  • 1
    $\begingroup$ Another issue to consider: are you interested in testing something other than the difference in means, or are you interested in conducting a test of the difference in means that is robust to violations of standard assumptions? $\endgroup$
    – Dave
    Commented Nov 15, 2019 at 21:02
  • $\begingroup$ @Dave I would like to make a conclusion wether the two groups differ significantly. Broadly speaking, a lower mtb ratio for g1 (5%group) would indicate that members of that group are (on average) more undervalued than g2 (95% group). Is it even useful to show the mean of both groups, when distribution is skewed, or is it better to just show medians? $\endgroup$
    – xander41
    Commented Nov 16, 2019 at 6:21
  • 1
    $\begingroup$ Differing significantly could take many forms, not all of which are at all related to average, such as $N(0,1)$ versus $t_{1.1}$. The means of skewed groups do not have as easy of an interpretation as the means of bell-shaped groups. The mean is not the halfway point, just the value of $\int_\mathbb{R}xf_X(x)dx$. At the same time, that integral may be quite meaningful to your work, such as if you’re interested in what works out best in the long term (casino-style probability). Ultimately, it comes down to what problem you want to solve. To me, it sounds like you want the mean, however. $\endgroup$
    – Dave
    Commented Nov 16, 2019 at 10:21
  • $\begingroup$ @Dave Thanks for your input. In the mtb example, my hypothesis is that group1 is more undervalued than group2, if mtb for group1 is lower than group2. Is it possible to use the median (the halfway point) instead and not show means at all? Or are there any other ways to show this? 2. Is outlier detection using 3*iqr rule valid for skewed distributions in research? Textbooks use it (still) frequently. Idon't want to use it, if it is highly inappropriate. As I mentioned 4.6% of the mtb data would be characterized as outliers. But the results seem more reasonable to me than winsorizing. $\endgroup$
    – xander41
    Commented Nov 16, 2019 at 10:51

3 Answers 3

4
$\begingroup$

I agree with @1muflon1(+1) about systematic removal of outliers, for no reason other than size. That is almost never useful. (Of course, outliers obviously due to data entry errors or equipment failure should be removed: A basketball player listed at 9' 6" tall, reports of a temperature -60$^o$F in Hawaii, etc.)

With sample sizes is the thousands, t tests on data that are not exactly normal can be useful. That is especially true for looking at the difference of two distributions with skewness in the same direction.

In the simulated data below the samples x1 and x2 are both large samples $n_1 = n_2 = 40\,000$ from right-skewed gamma distributions. However, a two-sample t test is useful in detecting the relatively small difference between them.

set.seed(2019)
x1 = rgamma(40000, 5, .1)
x2 = rgamma(40000, 5.1, .1)
t.test(x1, x2)

        Welch Two Sample t-test

data:  x1 and x2
t = -7.2698, df = 79983, p-value = 3.632e-13
alternative hypothesis: 
  true difference in means is not equal to 0
95 percent confidence interval:
 -1.4739377 -0.8479435
sample estimates:
mean of x mean of y 
 49.94401  51.10495 

enter image description here

However, a two-sample Wilcoxon (nonparametric test based on ranks) also finds a difference between population locations.

wilcox.test(x1,x2)

        Wilcoxon rank sum test with continuity correction

data:  x1 and x2
W = 776760000, p-value = 1.119e-12
alternative hypothesis: true location shift is not equal to 0
$\endgroup$
5
  • $\begingroup$ So, in your case, the Welch t-test would be appropriate? The problem with my data is that one group represents 5% of all data and the other 95%. Though 5% is still 2.000 data points. So, would Welch test be a valid option? Distribution of x1 and x2 are comparable. $\endgroup$
    – xander41
    Commented Nov 15, 2019 at 20:42
  • $\begingroup$ A gamma distribution has light tails. What about other distributions like Pareto etc? $\endgroup$
    – Michael M
    Commented Nov 15, 2019 at 22:08
  • $\begingroup$ I suppose Wilcoxon works better than t test for Pareto, depending on parameters. $\endgroup$
    – BruceET
    Commented Nov 16, 2019 at 1:01
  • $\begingroup$ I suppose Wilcoxon works better than t test for Pareto, depending on parameters. But for Pareto, it would be especially difficult to establish a trimming criterion that doesn't erase the essence of the data. $\endgroup$
    – BruceET
    Commented Nov 16, 2019 at 1:14
  • $\begingroup$ I'll probably switch back to winsorization like @1muflon1 also suggested. Still not the best option, but apparently more excepted and more widespread. Then, dependent on distribution characteristics, I'll use welch t-test or Wilcoxon. Maybe I also use (univariate) logistic regression for cross check. What do you think? $\endgroup$
    – xander41
    Commented Nov 16, 2019 at 16:30
1
$\begingroup$
  1. The views on deleting outliers differ but outlier should be some unusual observation that skews the results. If you have a lot of them I am not sure I would call them outliers anymore.

Also, using interquartile range is bit too simplistic and crude for my taste - you also don’t see it often in research - at least not in macro and international economics where I come from. I would recommend to winsorize data or to use even some more sophisticated technique.

  1. I would not use Welch’s test in this case. There are so many other options you could do some non-parametric test like wilcoxon test or bootstrap like @Dave suggests. The precise solution depends on specifics of your problem.

  2. I will let someone else answer this because I don’t have enough knowledge of the research on comparing financial ratios.

  3. Yes as was already mentioned in such case some non-parametric approach would be more appropriate.

$\endgroup$
0
0
$\begingroup$

Well I checked how many value's have been removed for mtb ratio according to the iqr. It`s 4.6% of more than 40.500. I also considered winsorizing but even the 95%percentile is a mtb ratio of 9.24. Though it reduces skewness, its still pretty high. Which are the advantages of winsorizing other than retaining the values? In what way is it advantages compared to iqr-rule?

According to the definition of Hawking: An outlier is an observation which deviates so much from the other observations as to arouse suspicions that it was generated by a different mechanism". When I look at the data, values so far from the median or even mean doesn't really make economically sense. Intuitively, it would make more sense for me to delete them. There are authors which by (expert) judgment, set limits i.e. no values above 5 and exclude all other values. This approach is not really systematic, imho.

Why is the Mann-Whitney U-Test preferable to Welch t-test?

Fagerland (2012): “Non-parametric tests are most useful for small studies. Research authors that use non-parametric tests in large studies may provide answers to the wrong question, thus confusing readers. For large studies, t-tests and their corresponding confidence intervals can and should be used even for heavily skewed data.” https://www.ncbi.nlm.nih.gov/pmc/articles/PMC3445820/

I’m still puzzled what to do?!

$\endgroup$
6
  • $\begingroup$ I don’t understand why high market to book ratio would be suspicious at all. MTB of 10 just means that the market value of company is 10 times as high as stated book value that is completely reasonable. Many startups start with small capital and hence have small book value but once they become successful the market value shoots up. $\endgroup$
    – 1muflon1
    Commented Nov 15, 2019 at 21:57
  • $\begingroup$ What do you mean by startups? I'm talking about listed companies. There is no doubt that there are companies with high mtb in the market. Some industries, i.e. software have higher mtb. But on average mtb is what I posted before. Damodran posts an average of 3.18 for all industries. pages.stern.nyu.edu/~adamodar/New_Home_Page/datafile/… Funny though tabacco, has the highest industry average (but only 17 comps) :-) $\endgroup$
    – xander41
    Commented Nov 15, 2019 at 22:20
  • $\begingroup$ Startups are just an first example that came to my mind it can happen to any firm as a matter of fact startups probably have MBT higher than that. The point I was making is that i don’t think it’s correct to say that firm with high MTB is suspicious $\endgroup$
    – 1muflon1
    Commented Nov 16, 2019 at 5:17
  • $\begingroup$ So, am I correct that winsorizing has the advantage that it keeps the direction of original distribution, but reducing the influence of outliers. Would winsorizing takes places on the entire sample (10yrs) or on a yearly basis? Is there a recommendation? Thanks a lot $\endgroup$
    – xander41
    Commented Nov 16, 2019 at 5:35
  • $\begingroup$ @1muflon1: I just added two histograms in my original questions, showing the different effects using winsorization and iqr, where winsorization is peformed on the complete 10yr sample. $\endgroup$
    – xander41
    Commented Nov 16, 2019 at 6:23

Your Answer

By clicking “Post Your Answer”, you agree to our terms of service and acknowledge you have read our privacy policy.

Not the answer you're looking for? Browse other questions tagged or ask your own question.