This question is about the effects of grouping (or equally, subdividing) data on the outcome of a Chi-Square test. I'm relatively new to all this so please be gentle.
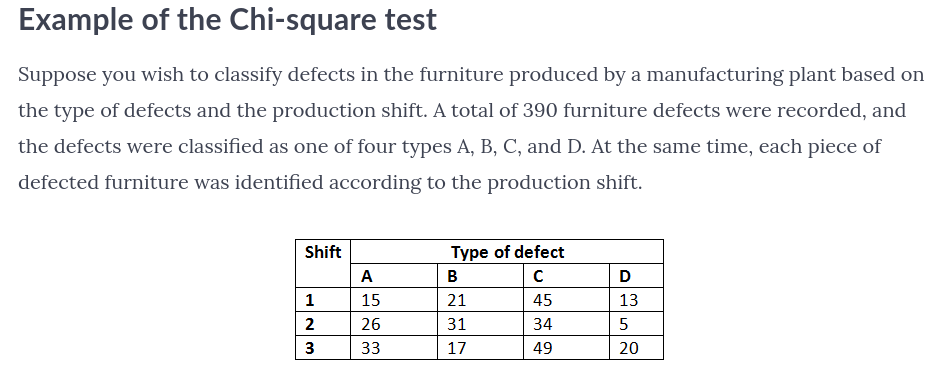
Anyway: I've been through the example below from this tutorial Manufacturing Defects; and got the same answers as the tutorial; so far so good.
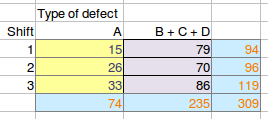
I've been trying to digest what the test result means in human terms. In real life situations it is entirely possible that (say) defects C and D are hard to distinguish, or perhaps even defects B, C and D are similarly hard (or any other grouping of columns, I just chose these arbitrarily). For example in the latter case I would re-run the test with a different table, below, where the right hand column is the sum of the original columns B, C and D. The blue background cells are the row/col/grand totals.
We are getting near the question at last; here, below, is a summary of the results of three sets of analysis. The top row is the case shown in the tutorial, the lower two are my invention based on grouping the same data.
Finally! How should I understand these results? I was initially surprised to see that the last case changed from being significant to not. After a bit of reflection I realise that the C + D group of the second test (and the B+C+D group of the third case) has more data per cell than in the original analysis. Typically I'd expect the outcome to be different if the sample size is changed.
Q1 Is "all" that is happening is that the test is bound to give different results with the data being less sub-divided?
Q2 Does this still follow in the 3rd case where the significance test result changes?
Q3 Is there any other way of looking at it?


