23
$\begingroup$

For an ecology project, my lab group added vinegar to 4 tanks containing equal volumes of pond water, 1 control with no elodea (an aquatic plant) and 3 treatments with the same amount of elodea in each. The purpose of adding the vinegar was to reduce the pH. The hypothesis was that the tanks with elodea would go back to their normal pH quicker. This was indeed the case. We measured the pH of each tank daily for about two weeks. All the tanks eventually returned to their natural pH, but the length of time that this took was much shorter for the tanks with elodea.

When we told our professor about our experimental design, he said that there exists no statistical test that can be performed on the data to compare the control to the treatment. That because there was no replicate for the control (we only used one control tank) we cannot calculate variance and so we can't compare the sample means of the control and the treatment. So my question is, is this true? I definitely understand what he means. For example, if you took the height of one man and one woman, you can't draw conclusions about their respective populations. But we did 3 treatments, and the variance was small. It seems reasonable to assume that the variance would be similar in the control?

Update:

Thank you for the excellent answer. We got more water and elodea from the wetland and decided we would run the experiment again with smaller tanks but this time with 5 controls and 5 treatments. We were going to combine this with our original data but the starting pH of the tanks was different enough that it doesn't seem valid to consider the new experiment to be sampled from the same population as the original experiment.

We considered adding different amounts of elodea and trying to correlate speed of pH remediation (measured as time elapsed until pH returned to its original value) with amount of elodea, but we decided that wasn't necessary. Our objective is only to show that the elodea makes a positive difference, not to construct some kind of predictive model for exactly how the pH responds to differing amounts of elodea. It would be interesting to determine the optimal amount of elodea, but that's probably just the maximum amount that can survive. Trying to fit a regression curve to the data wouldn't be especially illuminating because of the various complicated changes that occur to the community when adding a large amount. The elodea dies, decomposes, new organisms start to dominate, and so on.

$\endgroup$
2
  • 4
    $\begingroup$ Did you add the same amount of Elodea to each of the 3 'treatment' tanks? $\endgroup$ Commented Nov 27, 2012 at 1:53
  • 2
    $\begingroup$ Yes, we added the same amount of Elodea to each treatment. $\endgroup$
    – Simon Hunt
    Commented Nov 27, 2012 at 2:51

1 Answer 1

26
$\begingroup$

Note gung's question; it matters. I will assume that the treatment was the same for every tank in the treatment group.

If you can argue the variance would be equal for the two groups (which you would typically assume for a two sample t-test anyway), you can do a test. You just can't check that assumption, no matter how badly violated it might be.

The concerns expressed in this answer to a related question are even more relevant to your situation, but there's less you can do about it.

You ask about it being reasonable to assume the variances are equal. We can't answer that for you, that's something you'd have to convince subject matter experts (i.e. ecologists) was a reasonable assumption. Are there other studies where such levels have been measured under both treatment and control? Others where similar tests (t-tests or anova especially - I bet you can find a better precedent) have been done or similar assumptions made? Some form of general reasoning you can see to apply?

However, it is important to note that for correctness of the significance level, you would only need equal variance under $H_0$. If the treatment had no effect under $H_0$ rather than just no effect on the mean, then this would hold. This might be a perfectly defensible position. If it was the case that the variance changed as the mean changed - something that is often the case with measured quantities that are inherently positive - then the test still works, though it may not be the most powerful test possible.

If $\bar{x}$ is the sample mean of the treatment and $\bar{y}$ is the mean of the control, and both are from normal distributions with variance $\sigma^2$, then $\bar{x}-\bar{y}$ will have mean $\mu_x - \mu_y$ and variance $\sigma^2 (1/n_x + 1/n_y)$ irrespective of whether one of the $n$'s is 1.

So when $n_y$ is 1,

$$ \frac{(\bar{x}-\bar{y})}{s_x\sqrt{1/n_x+1}} $$

(where $s_x$ is the standard deviation computed from the treatments) will be $t$-distributed (with $n_x - 1$ degrees of freedom) under the null.

You may notice that with the best available estimate of $\sigma$, $s_x$ used for $s_p$, this is exactly like the ordinary two-sample t-test formula with $n_y$ set to 1.

Edit:

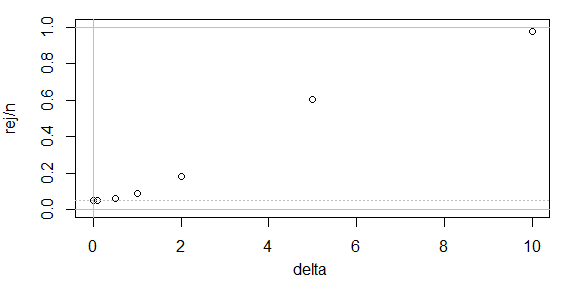
Here's a simulated power curve for this test. The simulation size at the null was 10000, at the other points was 1000. As you see, the rejection rate at the null is 0.05, and the power curve, while it requires a large difference in population means to have decent power, has the right shape. That is, this test does what it is supposed to.

power curve

(End edit)

With sample sizes so small, this will be somewhat sensitive to distributional assumptions, however.

If you're prepared to make different assumptions, or want to test equality of some other population quantity, some test may still be possible.

So all is not lost... but where possible, it's generally better to have at least some replication in both groups.

$\endgroup$
9
  • 2
    $\begingroup$ Note you will need to follow the formulas @Glen_b outlined. Both Excel and Minitab won't compute this. $\endgroup$
    – zbicyclist
    Commented Nov 27, 2012 at 4:01
  • 14
    $\begingroup$ (+1) An equivalent approach (using the same formula)--and therefore more ammunition for justifying this answer--is that you can compute a prediction interval for one future value from the treatment group. If the control value does not fall within that prediction interval, you have significant evidence of a difference between the two groups. The difference could be some combination of a difference in mean or a difference in variances, but there is (likely) a difference. $\endgroup$
    – whuber
    Commented Nov 27, 2012 at 8:23
  • 3
    $\begingroup$ @bdemarest An interesting thought, but it doesn't work. It asserts that the value '12' is known exactly (instead of being a random observation from a distribution with s.d. $\sigma$), leading to the formula $\frac{(\bar{x}-12)}{s_x\sqrt{1/n_x}}$ - in this particular case making the value under the square root a quarter of what it should and so making the $t$ value twice as large as it should be. $\endgroup$
    – Glen_b
    Commented Nov 28, 2012 at 1:19
  • 2
    $\begingroup$ @Glen_b: Not sure if this has changed this last November, but R 3.0 will do a pooled t-test when one of the sample sizes is one, and gives the same answer as an anova. $\endgroup$ Commented Aug 20, 2013 at 1:02
  • 2
    $\begingroup$ For anyone wanting to try it in R: t.test(x=c(4.5,4.8,4.6),y=5.2, var.equal=TRUE) -- it looks like this works in both R2.15.2 and R3.0.0 (the only two versions I have handy). $\endgroup$
    – Glen_b
    Commented Aug 20, 2013 at 2:22

Your Answer

By clicking “Post Your Answer”, you agree to our terms of service and acknowledge you have read our privacy policy.

Not the answer you're looking for? Browse other questions tagged or ask your own question.