8
$\begingroup$

This is a strange case of difference in fatality rate between Chinese and Italian covid-19 outbreak.

In my knowledge, fatality rate is a ratio between deaths from a certain disease compared to the total number of subjects diagnosed with the disease.

Starting from this assumption, I attempted to analyze difference in fatality rate between Chinese/Italian outbreak. Herein, I propose a reproducible R example for exploring this variable:

# Import dataset from authoritative source:  
 # https://ourworldindata.org/coronavirus-source-data
 covid <- read.csv("https://covid.ourworldindata.org/data/ecdc/full_data.csv")
        
 # Subsetting only data from China and Italy
 dataset <- subset(covid, location == "China" | location == "Italy")
        
 # Fatality ratio: is the proportion of deaths from a certain disease compared to the 
 # total number of people diagnosed with the disease for a certain period of time.
 dataset$fatality <- round(dataset$total_deaths/dataset$total_cases*100, 2)
    
 # Outbreak duration in days 
    dataset$days <- difftime(dataset$date,min(dataset$date), units="days")
    
    
  # Generating plot
    library(ggplot2)
    ggplot(dataset, aes(days, fatality, color = location, group = location))+
      geom_smooth(size= .5, alpha=.25, color = "gray65")+
      geom_line()+
      geom_point()+
      labs(x="Outbreak duration (days)", y= "Fatality rate (%)", color = "Location")+
      theme_light(14)

EDT: enter image description here Bar Plot

# Generating bar plot
library(ggplot2)
ggplot()+
  geom_bar(data=subset(dataset, location == "China"), 
           aes(days, fatality, fill = "China"), 
           stat = "identity", position = position_dodge(), alpha = .75)+
  
  geom_bar(data=subset(dataset, location == "Italy"), 
           aes(days, fatality, fill = "Italy"), 
           stat = "identity", position = position_dodge(), alpha = .75)+
  
  labs(x="Outbreak duration (days)", y= "Fatality rate (%)", fill = "Location")+
  scale_fill_brewer(palette = "Set1")+
  theme_light(14)
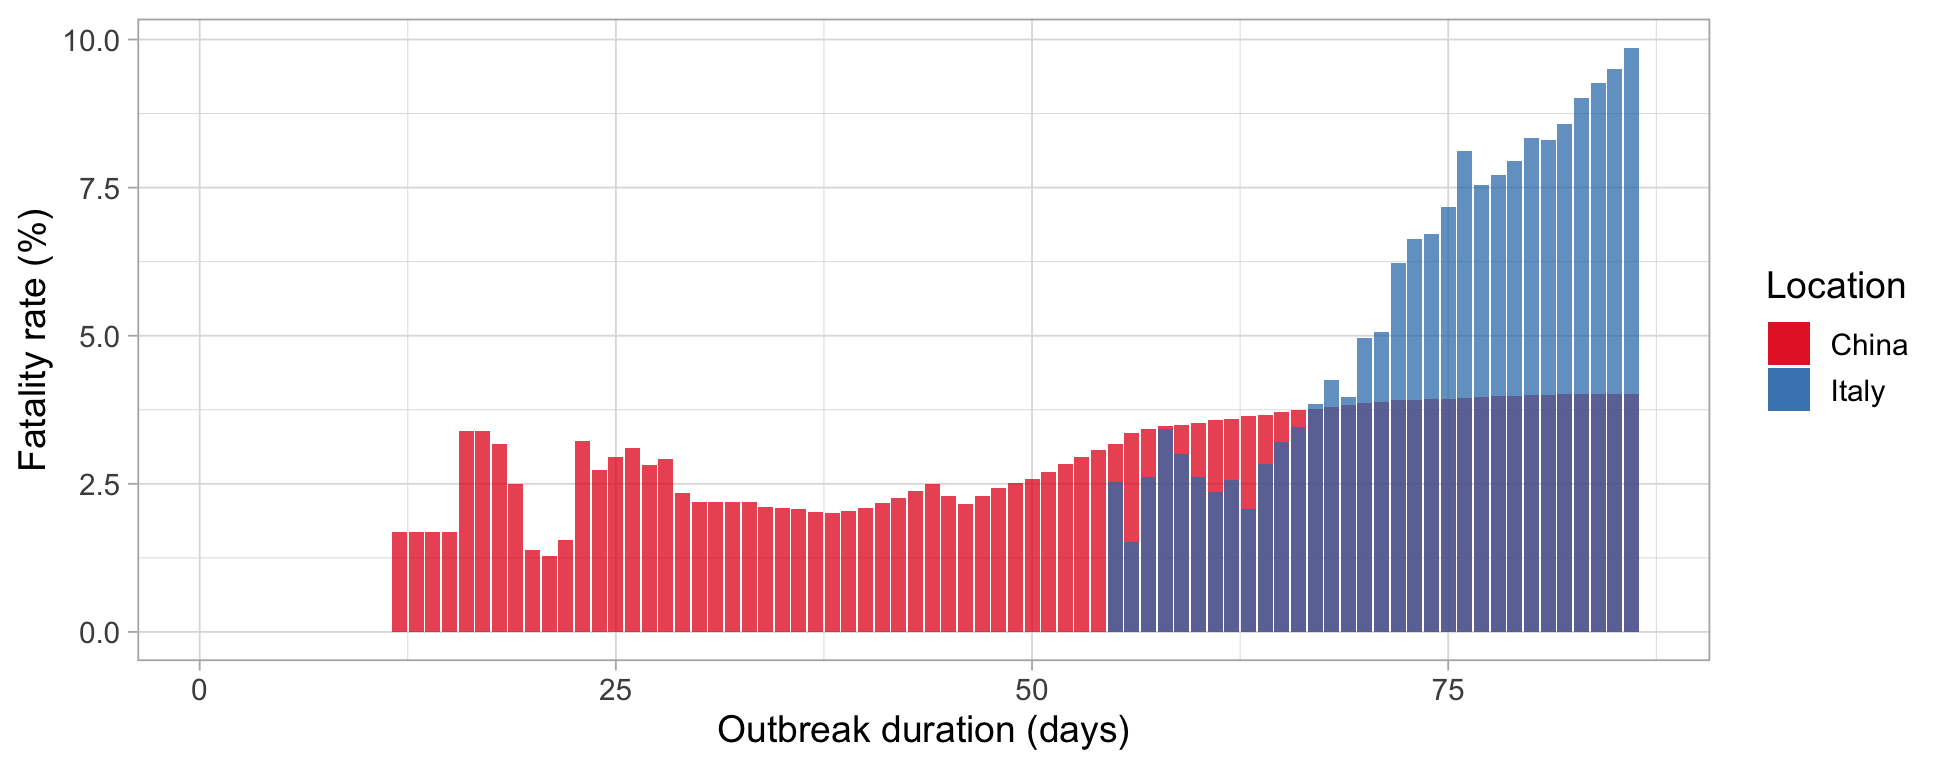
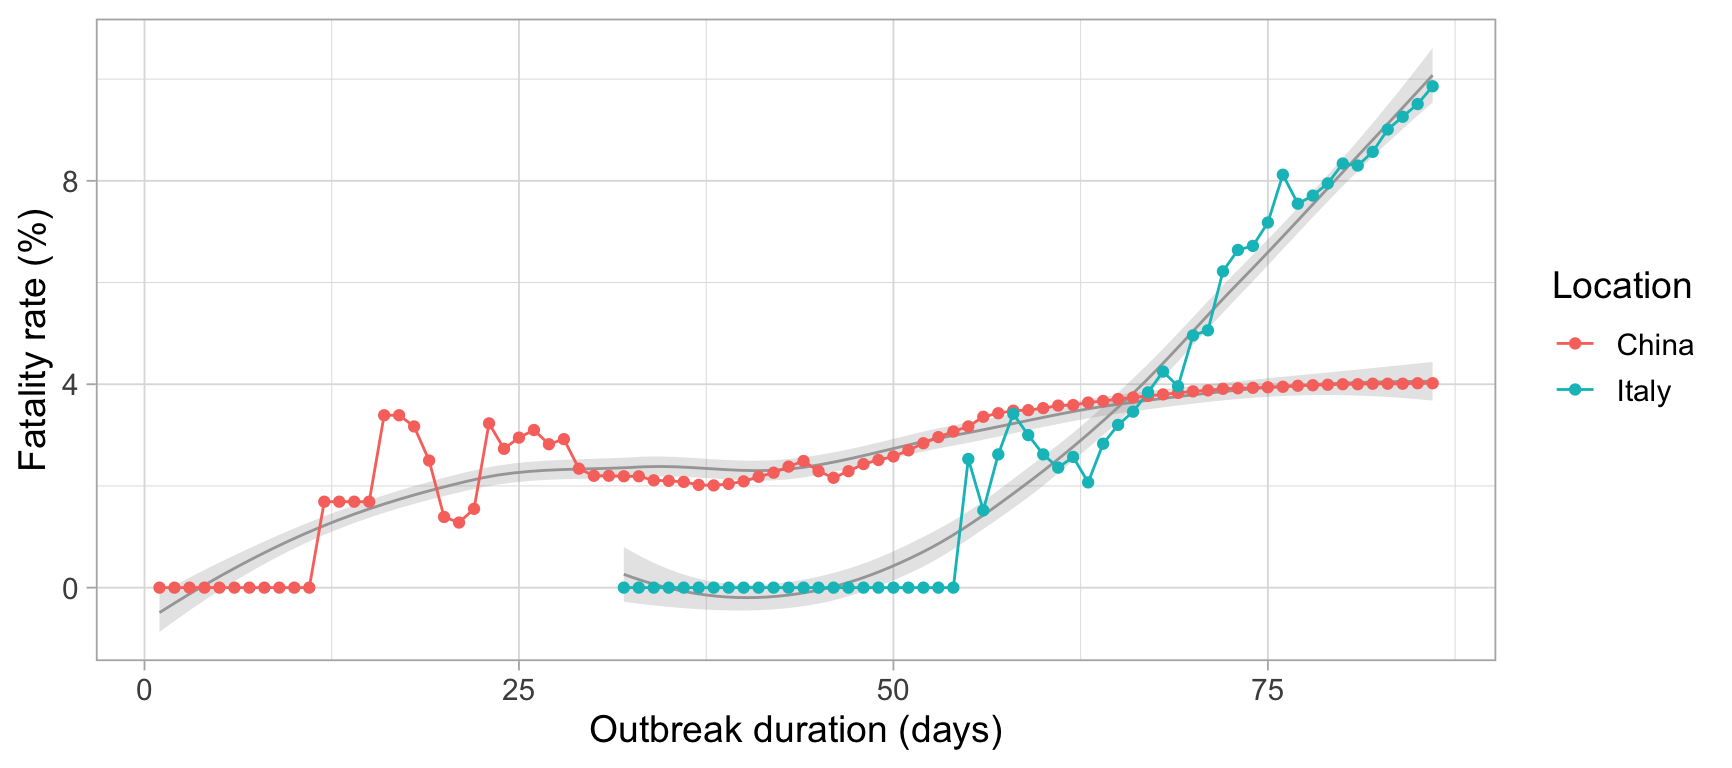
enter image description here From this basis, I'm a little bit confused about such difference in terms of fatality rate between the two analyzed countries. In fact, China has the maximum fatality rate at 4%, while Italy at more than 6%. For this reason I've two questions:

  1. Is my computation correct?

  2. If yes, why such a huge difference in terms of fatality rate?


EDT II

I would like to improve this question reporting a recent Science paper which can partially explain these differences. In fact, Li et al reported that for each COVID+ patient, other 5-10 are undocumented COVID+ leading to missleading fatality rate. Moreover, as reported in the comments, to date, there are no univocal diagnostic methods wordwide.
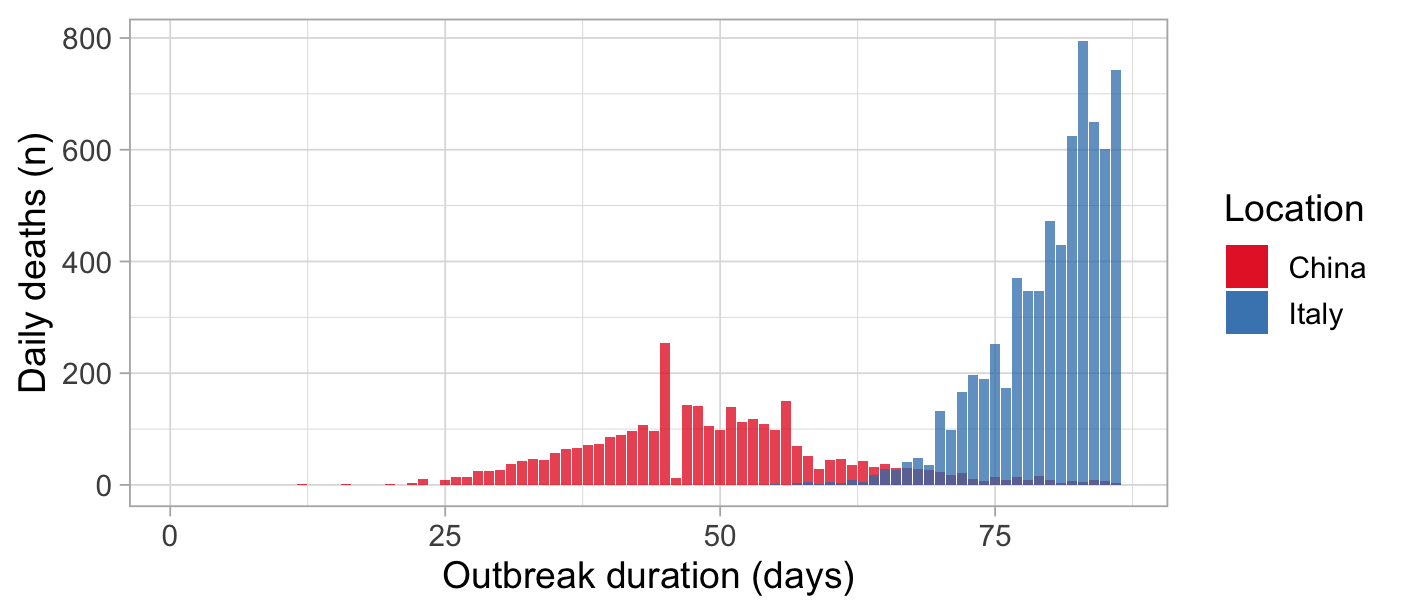
However, Italy is experiencing a huge increment in daily cumulative deaths compered to China:

# Generating bar plot
library(ggplot2)
ggplot()+
  geom_bar(data=subset(dataset, location == "China"), 
           aes(days, new_deaths, fill = "China"), 
           stat = "identity", position = position_dodge(), alpha = .75)+
  
  geom_bar(data=subset(dataset, location == "Italy"), 
           aes(days, new_deaths, fill = "Italy"), 
           stat = "identity", position = position_dodge(), alpha = .75)+
  
  labs(x="Outbreak duration (days)", y= "Daily deaths (n)", fill = "Location")+
  scale_fill_brewer(palette = "Set1")+
  theme_light(14)

enter image description here

Something is happening there! Hubei province is almost similar to Italy in terms of surface and population but very different in terms of population mean age since Italy is one of the oldest EU country.

$\endgroup$
6
  • 1
    $\begingroup$ Regarding your 2nd edit: The difficulty of detecting all cases of infection are also in some way present among detecting all cases of death were the cause of death is in some cases not so easy to verify. There are many more people with pneumonia (due to flu and regular common cold) than only the people with sars/covid-19 and Italy has normally 14k deaths per year due to this. Of which you can estimate 40% fall in the first quarter giving almost 6k deaths due to non sars pneumonia. Some of these may now be counted as covid-19 deaths. $\endgroup$ Commented Mar 18, 2020 at 22:04
  • 1
    $\begingroup$ The 6k deaths due to regular pneumonia and classification problems of cause of deatg does not explain the entire difference in number of deaths. It may be a combination with other factors: 1 different rate of spread (e.g. Italy has celebrated carnaval whichpotentially caused a huge initial rate of spread) 2 different age of population (Italy has a lot old people and they may be more clustered together) 3 different additional problems (e.g. presence of AIDS or people with cancer and related reduced immunoresistance) $\endgroup$ Commented Mar 18, 2020 at 22:08
  • $\begingroup$ @SextusEmpiricus I appreciate your interesting comments! Thanks $\endgroup$
    – Borexino
    Commented Mar 18, 2020 at 22:11
  • 1
    $\begingroup$ So based on this change of the question, looking at differences in total deaths, I would scale by the size of 65+ old population for the respective regions (which is a bit arbitrary where you draw the border, but it may show somewhat whether it makes sense to compare such different countries). $\endgroup$ Commented Mar 18, 2020 at 22:11
  • 1
    $\begingroup$ I found out that the suggestion in my last suggestion won't work. Hubei is much larger than North Italy, so this division will only make the numbers for Italy look worse, but then the question arises if one should count all of Hubei/Wuhan. But anyway, you could also look at the fraction of people with age 65 years and above. This is twice larger in Italy in comparison to China. $\endgroup$ Commented Mar 18, 2020 at 22:22

3 Answers 3

5
$\begingroup$

Reason 1 something technical about the computation.

Dying occurs with some delay to getting sick. As a consequence the ratio of people that got sick and the people that have died, is not equal to the ratio of people that will die.

(Still, if the number of sick cases and death cases both grow exponentially with the same factor then you might still expect this number to remain constant, but keep in mind that the growth is not exponential and that it is only a simplified model)


Reason 2 something important about the data acquisition

You might say, ok then let's compare the number of death cases with the number of sick several days ago (according to the average number that it takes between getting sick and dying).

But, the most important reason why the death rate based on these statistics is not constant and not comparible is because those numbers are only the reported cases and those may be a lot less than the real cases. So you are not computing a real death rate.

The statistic (reported/confirmed cases) is not what you think that it is (number of cases). This is especially clear in the curve of cases for China which has a bump because the number of cases rapidly increased after the defenitions were changed (from positively tested people to people with clinical symptoms)

$\endgroup$
7
  • 1
    $\begingroup$ Indeed, some organizations are now being more careful in their wording, eschewing the term "mortality rate" and instead stating what the number actually is - the proportion of confirmed cases who have died. $\endgroup$ Commented Mar 12, 2020 at 18:14
  • 1
    $\begingroup$ I still have concerns regarding the question. In your Reason 1 you correctly stated that "dying occurs with some delay to getting sick"; this may lead to an underestimation of fatality rate in Italian sample due to shorter outbreak compared to the Chinese one, while we observed an overestimation. I'm more confident about your Reason 2 even though, for what I know, Italian diagnoses are based on two consecutive positive RT-PCRs for covid-19, thus resulting in less-false positive compared to the Chinese diagnosis which, indeed, is based on CT scan which is more prone to false-positive. $\endgroup$
    – Borexino
    Commented Mar 12, 2020 at 20:25
  • $\begingroup$ References Chinese diagnoses method. RT-PCR test remains the reference standard to make a definitive diagnose of COVID-19 infection despite the false-negative rate. $\endgroup$
    – Borexino
    Commented Mar 12, 2020 at 20:30
  • 1
    $\begingroup$ @Borexino You mention a lot of technical test details, but even when Italian/Chinese tests would be similar then we still have to deal with the situation that not all people that are sick are being tested (and confirmed). For me, that seems to be a far more important aspect of the way that the data is being acquired. There is a particular sort of selection bias. The tests are only performed on a selected group and the numbers are far from accurate. I consider this arithmomania by the public and media detrimental; the numbers are nonsense. $\endgroup$ Commented Mar 12, 2020 at 20:45
  • 3
    $\begingroup$ There are also reports that when a patient had a preexisting condition, such as the heart or lung impairments that are major risk factors, China has been attributing deaths to those conditions exclusively. $\endgroup$ Commented Mar 13, 2020 at 3:21
0
$\begingroup$

Note in your wikipedia definition of case fatality rate, you NEED to know the eventual outcome of all individuals infected with disease. As they note, of the 100, 9 die, and 91 recover, they do not live with infection. Your data do not show the number who recovered from disease. If the lag between confirmed case and death is long, you underestimated CFR. CFR can also be biased by the number of unconfirmed cases who die from disease and are confirmed as cases based on cause of death.

$\endgroup$
0
$\begingroup$
  1. recently something occurred to us when we also perform test. The fatality rate does not quite describe number of death by certain disease to start with. We performed test against Covid-19 patient who have/not have chronic disease. it turns out patient who have chronic disease would have more chance to develop Pneumonia and acute respiratory. it might not because of covid-19 virus who caused death. It might be chronic disease or other condition.

  2. if you study medical system every patient would likely to be grouped by DRG code. DRG code is hospital way of group all disease for a particular patient and decide patient priority. In other words a lot of disease are appear together and it might be pre-existing disease who lower down immu system which cause death. As far as i know a lot patient in china who were not able to be diagnosed might be categorised under different reason instead of Covid (flu for example)

  3. Death rate can not reflect age group. As we all know by know this virus are particularly worse for senior. Therefore we can not compare country which have more senior population with country who have middle age

  4. death rate is complicated you also might not compare with right stage. until all patient discharge from hospital you would not know those who admitted would die or discharge

$\endgroup$

Your Answer

By clicking “Post Your Answer”, you agree to our terms of service and acknowledge you have read our privacy policy.

Not the answer you're looking for? Browse other questions tagged or ask your own question.