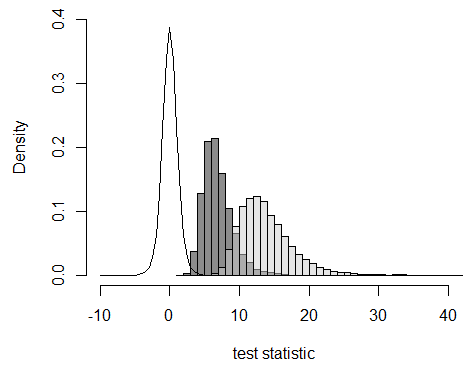
In null hypothesis significance testing, when a specific alternative hypothesis is specified (e.g., power analysis), why the distribution of the test statistic when the alternative hypothesis is true becomes flattened (and asymmetric) as effect size increases?
For example, in the one-sample t-test, the test statistic is $t=\frac{\bar{x}-a}{s/\sqrt{n}}$ where $a$ is the value from the null hypothesis. From this formula, it looks like the test statistic values are only shifted by its mean as $s$ is independent of the effect size. However, when I plot them, I see the distributions are skewed and flattened.
n <- 10  # sample size
s <- 10  # standard deviation
nsim <- 10000
tval1 <- tval2 <- rep(NA,nsim)
for(i in 1:nsim){
x1 <- rnorm(n,mean=20,sd=s)    # effect size 20
x2 <- rnorm(n,mean=40,sd=s)    # effect size 40
tval1[i] <- (mean(x1)-0)/(sd(x1)/sqrt(n))
tval2[i] <- (mean(x2)-0)/(sd(x2)/sqrt(n))
}

hist(tval1,breaks=25,freq=FALSE,xlim=c(-10,40),ylim=c(0,0.4),col=rgb(0.1,0.1,0.1,0.5),main="",xlab="test statistic")
hist(tval2,breaks=50,freq=FALSE,add=TRUE, col=rgb(0.8,0.8,0.8,0.5))
curve(dt(x,df=n-1),add=TRUE) # null distribution

