1
$\begingroup$

Goal

I am analyzing multiple time series data. I want to show there is difference in trend of the data after an event happens, either right after or a bit later, and it is statistically significant. I already know when the event happened.

About time series data

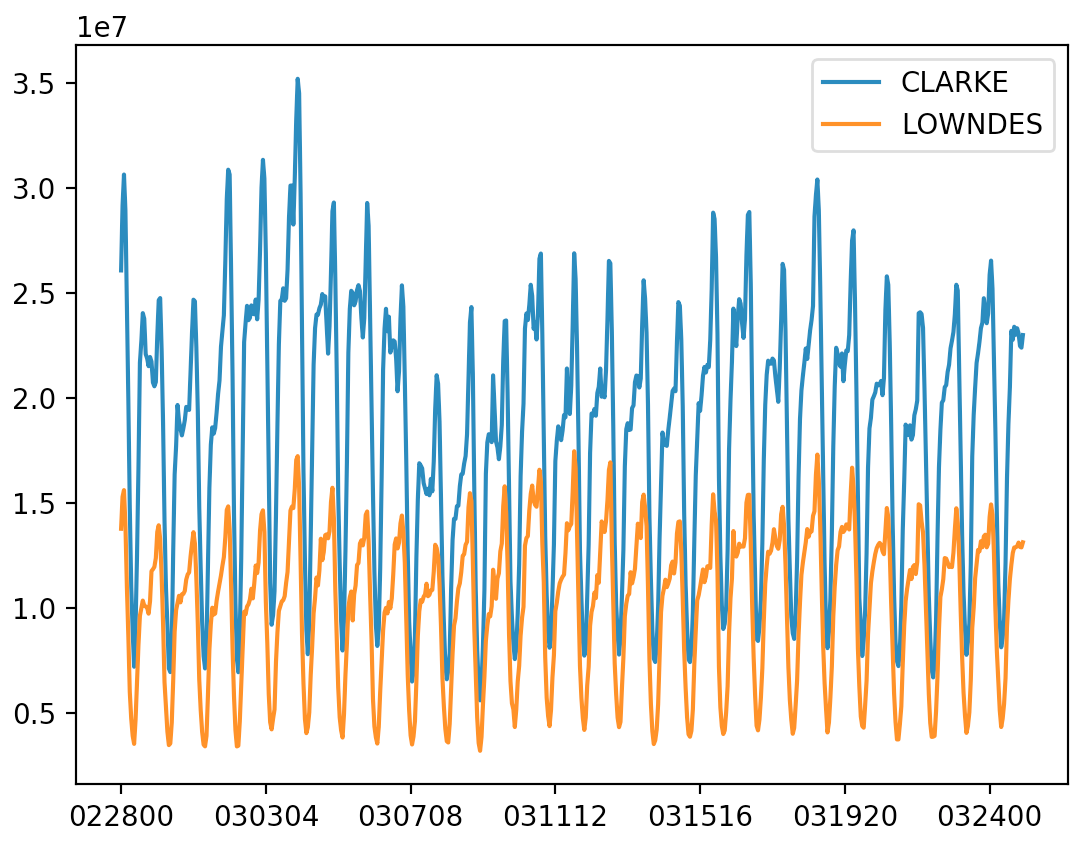
The time series is directly related to the human behavior, so it has multiple seasonal pattern; diurnal pattern, and difference of volume between weekdays and weekend. It would also have increased in long-term (more than 2 ~ 3 years) view, but it does not matter since I am working on 4 ~ 8 weeks. Here I am attaching two sample time series. Each data point represents an hour. two sample time series
My approach so far

After some searches, I have learned that structural break test would be good for this case. So I tried Chow test and ARIMA model, but neither have been successful. I think the trickiest part is that the problem is containing two different statistical characteristics; I need (1) statistical significance for the causality in the (2) seasonal time series. Chow test and ARIMA seem proper for (1), but I have encountered multiple problems.

Questions

All questions are somewhat related, but I want to clearly show my concern with the separation.

  1. Basically, I am still not sure what would be the best way to show the statistical significance of an event and its effect in the time series.

  2. Chow test and ARIMA assume the input time series is stationary, but only some data are stationary in Dickey-Fuller test and all of them are seasonal. Can I still use them after the transformation to be stationary (e.g., data point - moving average)? I am worrying about whether the transformation can affect on the original goal - getting statistical significance value.

  3. Simple Chow test seems somehow working, but I am afraid whether the test is still useful to assess the complex non-linear (and seasonal) models.

  4. If ARIMA is okay toward my goal, how can I show the statistical significance of an event with the model? It seems more for forecasting.

Thank you for reading!

$\endgroup$
1
  • $\begingroup$ Perhaps using regression with ARMA errors (e.g. via the R function arima with exogenous regressors) and modelling the multiple seasonalities by Fourier terms could help. I am not sure about implementation of Chow-type tests there, but you could add a level shift or some other deterministic pattern via a regressor and test for its significance. $\endgroup$ Commented Apr 8, 2020 at 6:35

1 Answer 1

0
$\begingroup$

I'm assuming this a singular and non-recurring event.

  1. At minimum you can/should test differences in time-averaged means, medians, variances, etc., for pre vs. post event. Kolmogorov-Smirnov test and others can work. This is probably the "best" way because of its simplicity. The problem is that significant differences in these tests are only a sufficient but not necessary condition, i.e. null results do not prove there's no difference pre vs. post. If there is a difference, your work is done. Stationarity tests are extensions of this approach, anyway. For instance, in the case of the Chow test, a difference in autoregressive intercepts and slopes affects the pre vs. post central tendency and variability (though not always, hence ARIMA models altogether).

  2. The problem with the Chow test is exactly the seasonality, i.e. the assumption that the pre/post autoregressive error terms are iid normally distributed. You should plot to see the extent to which normality is violated, it should look closer to uniform. The iid condition is violated by the seasonality and can be visualized by plotting the residuals over time and their autocorrelation. Differencing will not resolve the problem, either, because the data are oscillatory and sin and cos are infinitely differentiable functions. Seasonal differencing will work, in this case; subtracting the time point from its equivalent time point in the previous season. See 4.

  3. With seasonality the Chow test is not useful.

  4. You would want to use a seasonal ARIMA which is different than a non-seasonal ARIMA. Here is somewhere to start in R:

    https://otexts.com/fpp2/seasonal-arima.html

    I'd suggest using bootstrap to generate confidence intervals for the pre/post ARIMA coefficients, but this is not common practice yet. For each bootstrap sample, fit the model, shuffle the residuals, then add shuffled residuals to the predicted data, recompute the model, save coefficients. You'll get a bootstrap distribution for each of your coefficients from which to derive your confidence intervals. A cursory googling shows that this is actually already implemented for ARIMA models in R:

    https://rdrr.io/cran/TSA/man/arima.boot.html

    To test significance, it should be as simple as checking to see if the pre/post ARIMA coefficients have overlapping 95% confidence intervals. There is also a question of correlated errors, in which case block bootstrap may be necessary instead, see here:

    https://en.wikipedia.org/wiki/Bootstrapping_%28statistics%29#Block_bootstrap.

$\endgroup$

Your Answer

By clicking “Post Your Answer”, you agree to our terms of service and acknowledge you have read our privacy policy.

Not the answer you're looking for? Browse other questions tagged or ask your own question.