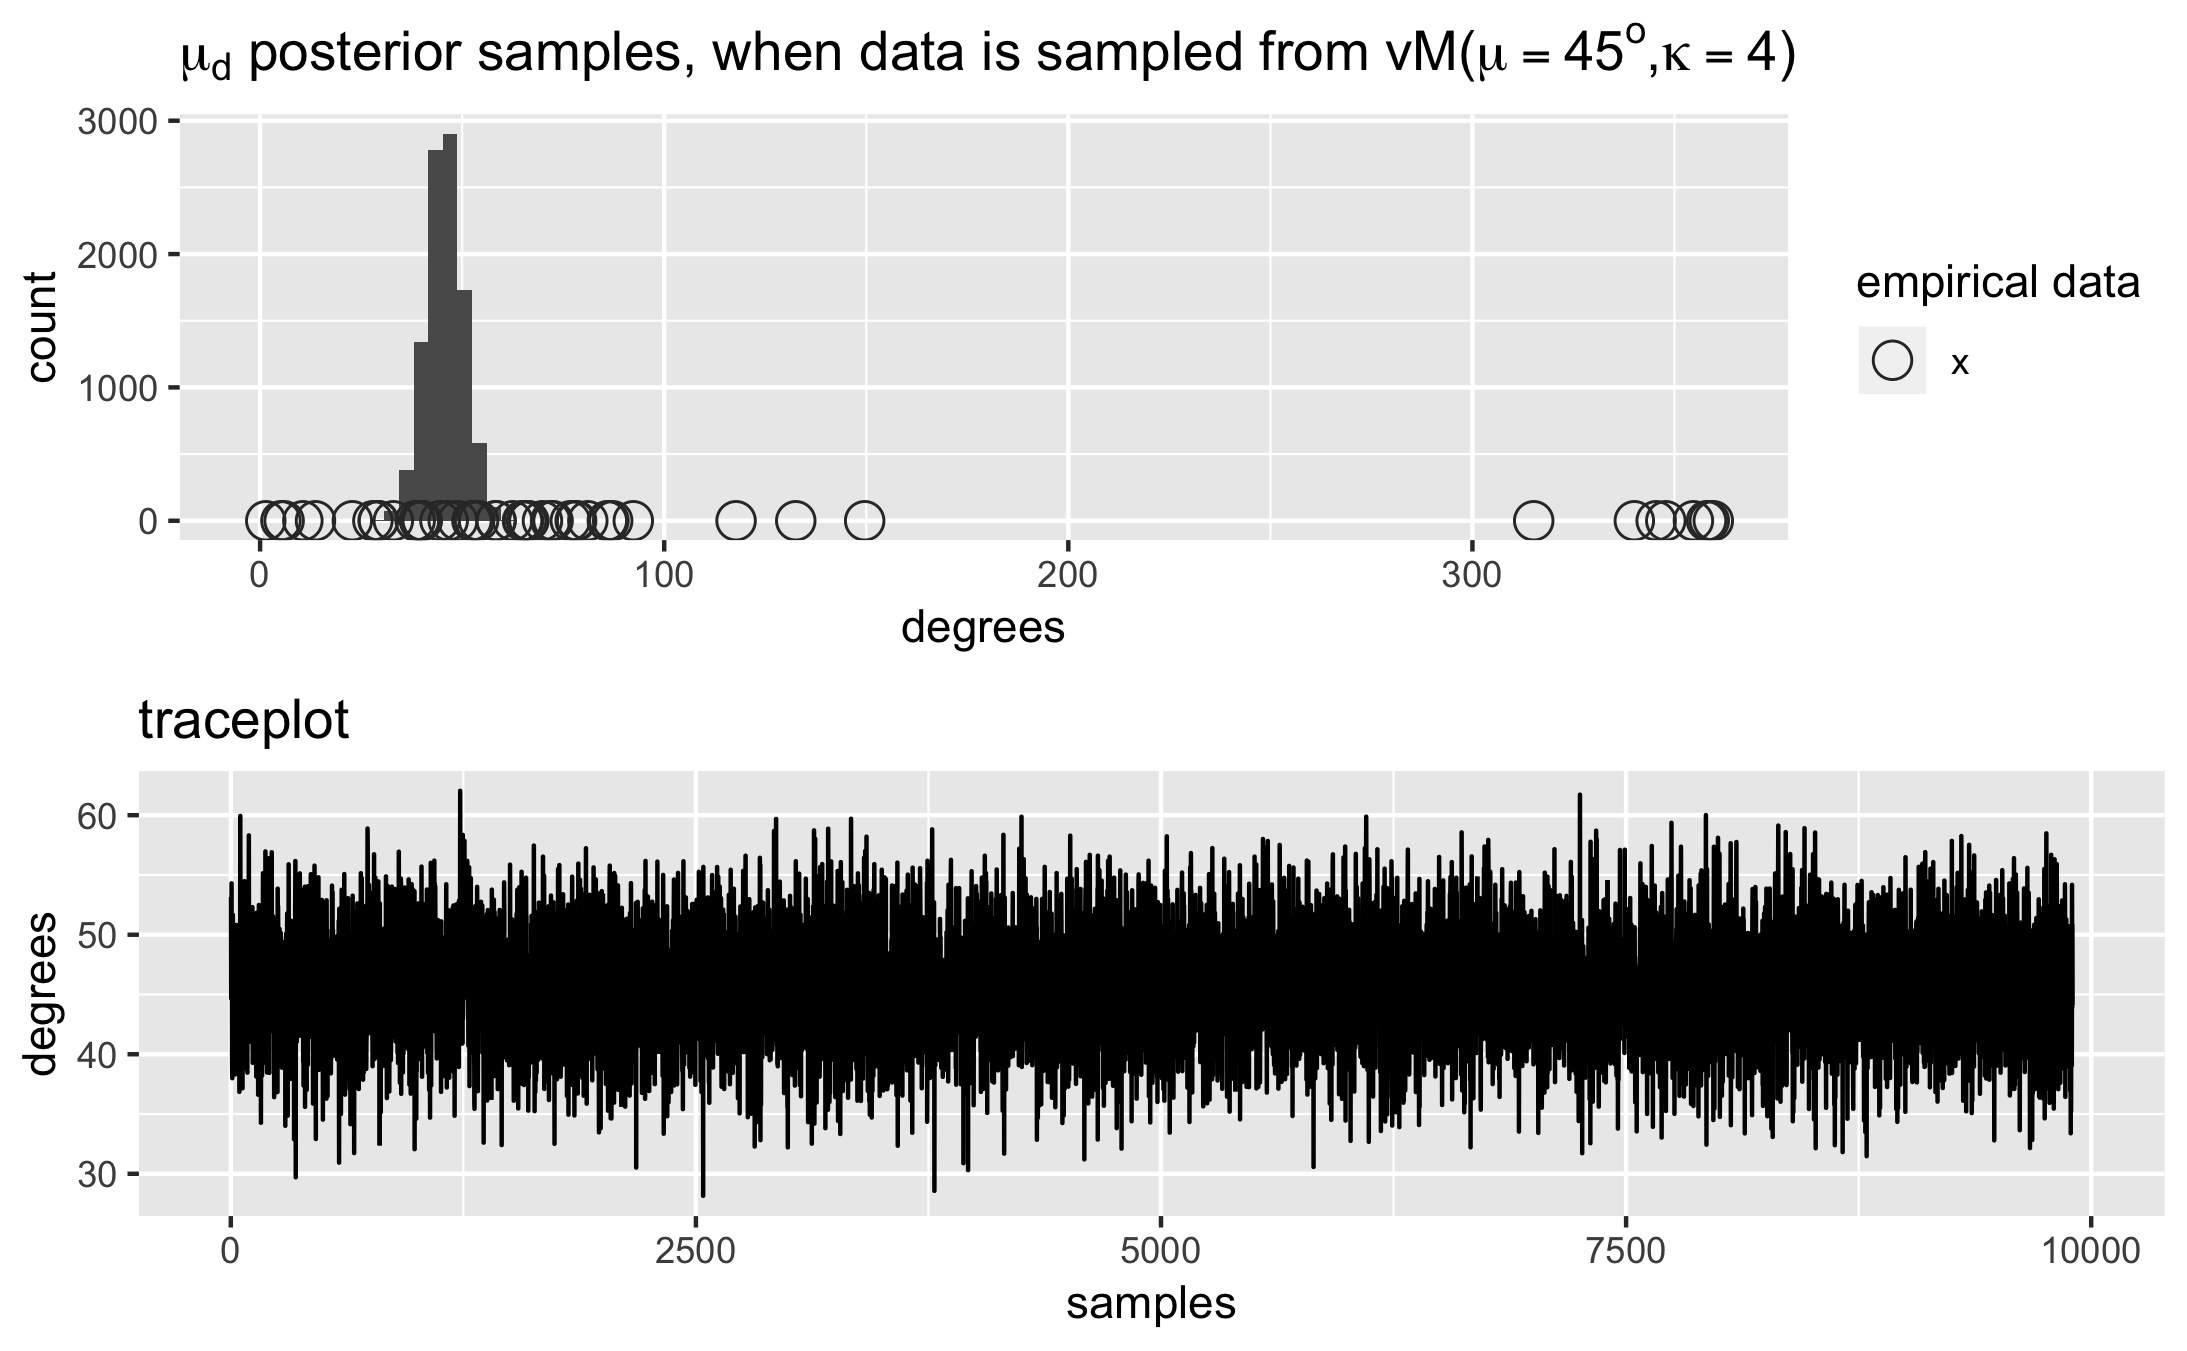
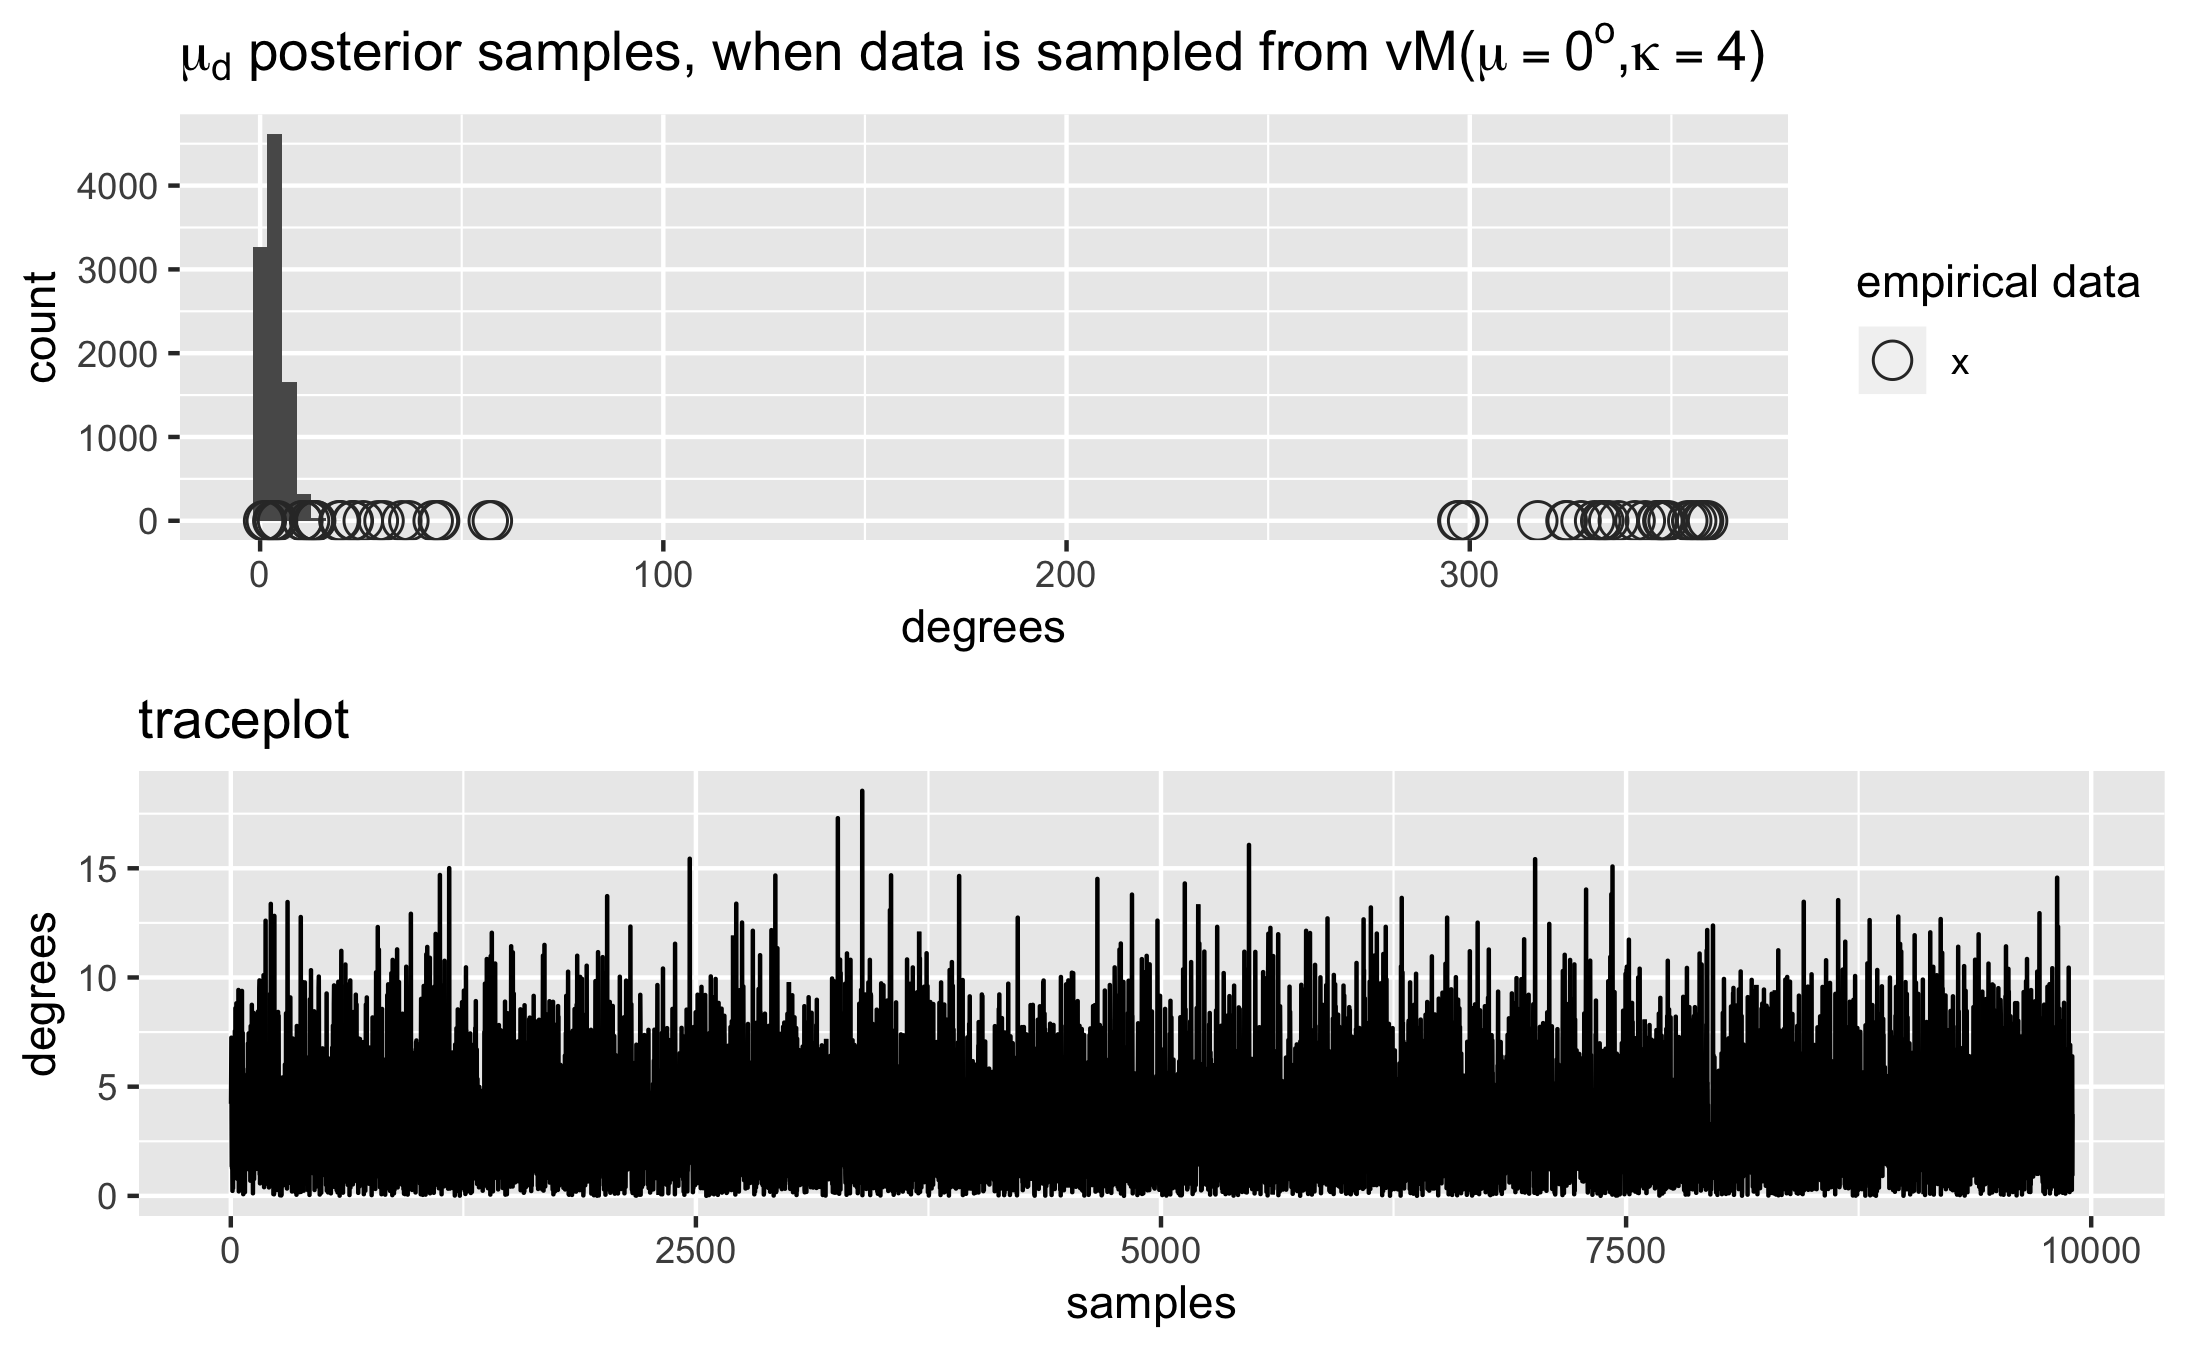
I've been using this dvonmises module/add-on to JAGS, and it's come very much in handy. However, I've run into an issue I was hoping someone might be able to help with. Essentially, samples from the posterior do not seem to sample across the threshold between 1 and 359 degrees. Assume I have the following (very simple, example) model
      model{
        pi2 <- 3.1416*2
        mu_d ~ dunif(0,pi2) # circular uniform prior
          for (i in 1:n){
            x[i] ~ dvonmises(mu_d, kappa = 4)
          }
      }
If I draw x from R's rvonmises(n=50, mu=0, kappa=4), then I expect the posterior sampling for mu_d to provide some values both above 0 degrees as well as below 360 degrees. However, these samples seem to be truncated, such that values all seem to be drawn from one side of the threshold, and it never obtains values from the other side of the threshold. This issue certainly seems to compound given more complicated models.
I'm not super familiar with all the inner workings of JAGS yet, and I know some issues like this can arise when a single chain gets "stuck in a rut" and gravitates around a certain value. In fact, I can get closer to the expected posterior on mu_d when I use multiple chains, but there's still some weird behavior there too that I attribute to this issue with the program estimating "above" 359 degrees or "below" 0 degrees. I presume it's something like jags "doesn't know" that the values wrap around and that 1 and 359 degrees are both equidistant from 0.
Does anyone know if this is generally a known issue for circular distributions in jags? Is there a known workaround?
As illustrative examples, I provide the model 50 samples of data sampled from a von Mises around the specified mu, with kappa = 4. Kappa is known to the model, and I run one chain, 10,000 iterations, 100 samples burnin.
The expected behavior (appropriately distributing around both sides of the empirical mean) is seen when the empirical mu = 45 degrees, seen below (where the circles represent the actual empirical data).
However, the truncation/constraining of samples is especially obvious in the traceplot for mu = 0, below:
Note that somewhere around 1500 more samples fall at the densest point in this "truncated" distribution compared to those that fall at the densest point in when mu = 45. This makes me think the program tries to draw above or below the threshold, and when it can't, it just lumps it all together at or close to the threshold value.
Note also that, sometimes, this constraining/truncation pools around the other side of the 360/0 threshold, such that all samples are drawn from just below 360 degrees, but none are drawn near the 0 end of the (linear) spectrum.


