0
$\begingroup$

I have a beyond beginner below professional understanding of statistics. let me explain my data, then the question.

I have three years of scores. Each year has about 40 items, but the exact number of items differs year to year. In addition to the year, each score has a couple other categorical variables. let's call all the variables A(3 options), B (15 options), and C(7 options) the scores are pretty highly skewed to the right each year. histogram of scores
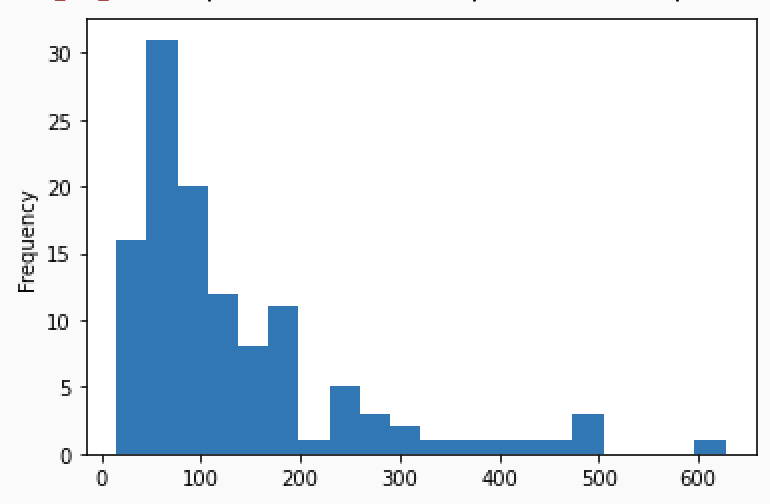
I would like to know a few things (1) how to compare the data by year given that they are not normally distributed. (2) sometimes i read studies that have a number of variables, and after they get an initial significant result, they do an analysis to see which ones are independent factors that predict the measured value. How does one do that and would it be appropriate here? (3) I've read statements like X explained 45% of the variance in Y. Which analyses give that information and would that be useful/appropriate here?

thank you

$\endgroup$
5
  • $\begingroup$ "Compare" is a little vague/broad. What are you trying to find out? $\endgroup$
    – Glen_b
    Commented Jun 9, 2020 at 10:18
  • $\begingroup$ in this context, compare means find out if scores are changing over time and if they are changing, whether the change is related any of the other factors besides the year $\endgroup$
    – anp925
    Commented Jun 10, 2020 at 3:10
  • $\begingroup$ "Change" is exactly as vague and imprecise as "compare", since you're comparing to identify if there was a change. Many things might change. What do you want to find out is changing? means? medians? medians of pairwise averages? 75th percentiles? If the spread changed but the mean didn't, would that be something you were particularly looking for? What if the distribution became more skew but the mean and variance didn't change at all? You need to be clear about what you're trying to find out. $\endgroup$
    – Glen_b
    Commented Jun 10, 2020 at 3:45
  • $\begingroup$ I want to find out if the score is changing. I'm asking what the best way to do that is. If the best way is to look at the medians, then that would be part of an answer to the question. I think it's reasonable to assume that if someone says they want to know if a score changes over time, it relates to the magnitude of the scores (are scores higher now than three years ago?). If someone doesn't ask about the score's spread etc., it's reasonable to assume that they aren't interested in those metrics, unless they are the best way to show that the magnitude changed or didn't change. $\endgroup$
    – anp925
    Commented Jun 10, 2020 at 6:46
  • $\begingroup$ I can't tell you if medians - or anything else - are what you're interested in for your problem. Or whether you need a general kind of alternative. $\endgroup$
    – Glen_b
    Commented Jun 10, 2020 at 6:48

1 Answer 1

0
$\begingroup$

OK. It sounds as if you have a psychometric or education test. You can fit models to the battery of tests, such as item response models https://lib.dr.iastate.edu/cgi/viewcontent.cgi?referer=&httpsredir=1&article=4417&context=etd

The idea is that there are two sets of underlying "latent" (hidden) variables. One will be specific to each individual, and there will be another set that is "item" (question) specific. This allows you to deal with the concept that some individuals generally score better than others, and that some items (questions?) are harder than others. A little problem here is that your errors can't possibly be normal because they are bounded by 0 and an upper bound (620?). I think your question is based on the idea you can fit such a regression model, and the R-squared value will give you the "percent of variation in Y explained by x". In my humble opinion, exploring the item response theory approach (which is a generalisation of these simple regression models) will give you a better handle on the question at hand.

Once upon a time, psychologists might have tried to use a simple linear regression model, $Y_i = \beta_0 + \beta_1 x_i + \epsilon_i$ where $x_i$ could be a before/after indicator variable. If this is what you are thinking of, you have a histogram of $Y$, the response variable. But all the assumptions are about the distribution of $\epsilon$, and you don't need these to be normal. They have to be zero mean, constant variance and independent.

$\endgroup$
3
  • $\begingroup$ thank you Paul. I like your answer. I'm just waiting a bit in case other people reply/comment. For this type of thing, I think getting lots of answers can help. If you need more details, I have scores for scientific papers related to their coverage on the Internet. And i'm looking at things like which journal, which institution, and the topic to see if those factors are related to any change in scores over time (if there is any). $\endgroup$
    – anp925
    Commented Jun 10, 2020 at 3:13
  • $\begingroup$ If lots of different answers help you, it means there's no one correct answer, and that's a pretty good sign that the question is too broad/unfocused for our Q&A format -- it would be more of a discussion topic. $\endgroup$
    – Glen_b
    Commented Jun 10, 2020 at 3:50
  • $\begingroup$ i disagree. sometimes there is no single correct answer. Sometimes an answer is good, but another answer is great. I asked 3 specific questions. The best answer would answer each subquestion clearly labeled with a 1,2, and 3. The answer above is good and I learned something that might help me if another answer doesn't come along. But, I'll wait for one that answers all the points clearly. $\endgroup$
    – anp925
    Commented Jun 10, 2020 at 6:46

Your Answer

By clicking “Post Your Answer”, you agree to our terms of service and acknowledge you have read our privacy policy.

Not the answer you're looking for? Browse other questions tagged or ask your own question.