When you take a sample from a population, you are gathering information about the population, which you might use for making a confidence interval or for testing a hypothesis about population parameters (perhaps the population mean $\mu).$
When you 're-sample' as in bootstrapping, you are analyzing data already taken from a population. Re-sampling does not provide any new information about the population. (But it
might help you better to understand the data you already have.)
You refer to two kinds of 're-sampling' that are in common use.
- In making a nonparametric bootstrap confidence interval, based on $n$ existing observations, you might take a large number $B$ of re-samples from your data. You would sample with replacement and re-samples would be of size $n.$
Nonparametric bootstrapping is often used when you do not
know the distribution 'family' of the population. (In particular, you would rarely use a nonparametric bootstrap for data known to have been sampled from a normal or an exponential population.)
- In making a parametric bootstrap, you typically know the distribution family of the population, but perhaps not the values of particular parameters (such as $\mu$ or $\sigma.)$.
In that case, you use the data to estimate parameters(s) and then use bootstrapping to get a confidence interval to go with each estimate. Then you use the estimated parameter value(s) to simulate a re-sample of size $n$ from the population. So you are not re-sampling directly from the data but from a population suggested by the data.
Nonparametric bootstrap CI for population mean.
Suppose I have a vector y that contains $n$ observations from a population of unknown distribution. I want to make a 95% nonparametric bootstrap confidence interval for the population mean $\mu.$
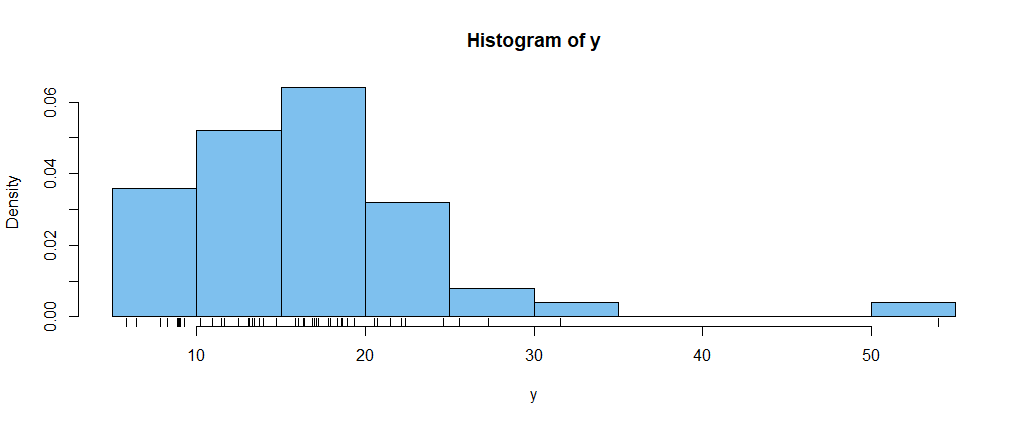
Here are summary statistics and a histogram:
summary(y); sd(y)
   Min. 1st Qu.  Median    Mean 3rd Qu.    Max.
   5.83   11.85   16.16   16.64   19.27   53.99
[1] 7.774901   # sample SD
hist(y, prob=T, col="skyblue2");  rug(y)

Here is R code to make a simple quantile bootsrap CI for $\mu.$ I take a large number $B = 3000$ re-samples of size
$n = 50$ from y and find the average $\bar X^*$ of each re-sample [denoted as a.re in the R code.].
set.seed(2020)
a.re = replicate(3000, mean(sample(y, 50, rep=T)))
quantile(a.re, c(.025, .975))
    2.5%    97.5%
14.65229 18.95220
So I could say that a 95% nonparametric bootstrap CI
for $\mu$ is $(14.7, 19.0).$ The interval contains the
sample mean $\bar Y = 16.64,$ but $\bar Y$ is not necessarily at the center of the CI. [Confession: Because I can see
form the histogram that the sample is skewed, it might
have been better to do a bias-corrected CI, but I'm
trying to illustrate re-sampling, but get into
nuances of various types of bootstrap CIs.]
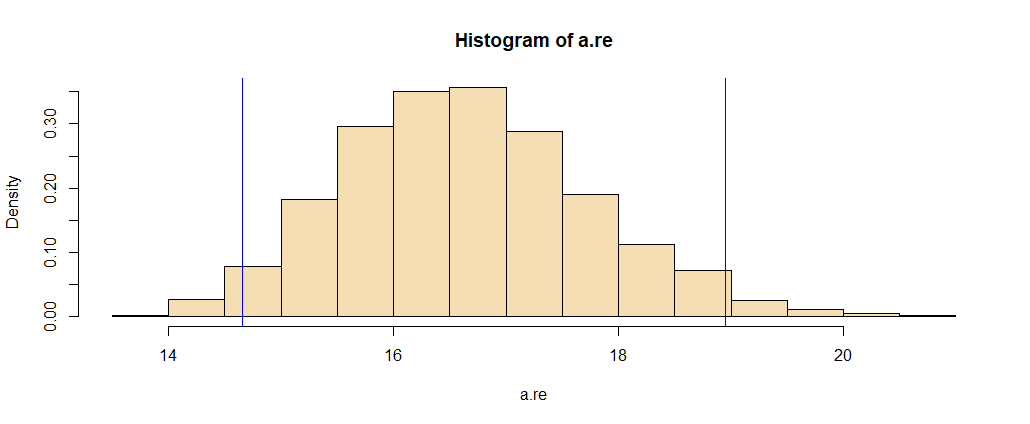
Below is a histogram of the re-sampled averages a with
vertical lines indicating the bootstrap CI for $\mu.$
hist(a.re, prob=T, col="wheat")
abline(v=q, col="blue")

Parametric bootstrap CI. Now suppose I know that
that the sample y came from a gamma distribution with shape parameter $\alpha = 5$ and unknown rate parameter $\lambda.$ A reasonable estimator of $\lambda$ is
$\hat \lambda = \alpha/\bar Y = 5/16.64 = 0.30.$
Now I simulate a large number $B = 3000$ samples of size
$n = 50$ from the distribution $\mathsf{Gamma}(\alpha=5, \lambda = .3).$ Then I find $\hat\lambda^*$ from each sample. At the end, I can use $(0.27, 0.34)$ as a 95% parametric bootstrap CI for $\lambda.$
set.seed(2020)
lam.re = replicate(3000, 5/mean(rgamma(50, 5, .3)))
q = quantile(lam.re, c(.025,.975));  q
     2.5%     97.5%
0.2668468 0.3416872
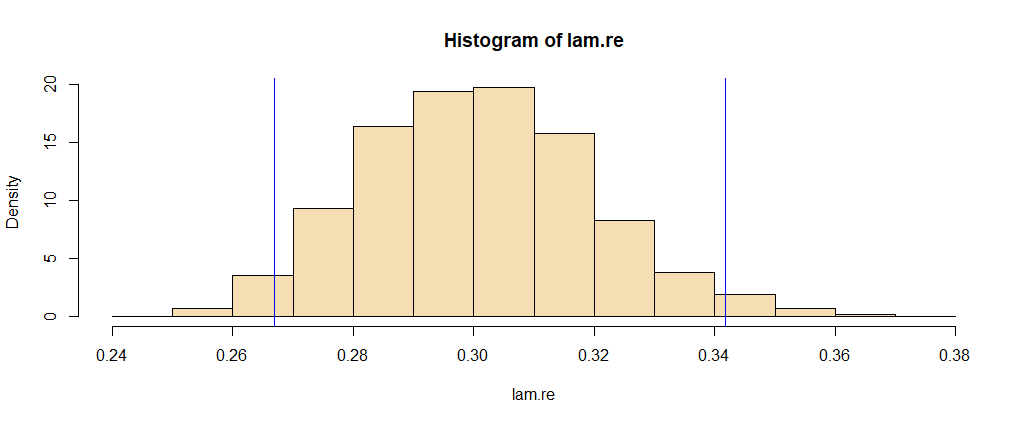
Here is a histogram of the bootstrap distribution of lam.re along with vertical bars showing the 95% parametric bootstrap CI for $\lambda.$ [There are ways
to use the gamma distribution to make a CI for $\lambda$
without bootstrapping. But in this case the bootstrap method works very well.]
hist(lam.re, prob=T, col="wheat")
abline(v = q, col="blue")

Remark. For both of these bootstrap CIs I did
re-sampling. But in these procedures I sample no
additional data from the population.
Note: In this case the 'population' was R's
function to generate gamma data. Data y for this demo
were sampled as follows;
set.seed(2020)
y = round(rgamma(50, 5, .3), 2)


