0
$\begingroup$

I'm running an A/B test to see if the improved website layout increases revenue. First, I would like to check if the sizes of the control and experiment groups are statistically different.

I have data on the number of users visiting the site per day within 29 days. Below I will insert the data from the first 5 days:

Day Control Visits Experiment Visits
1   1764           1850
2   1541           1590
3   1457           1515
4   1587           1541
5   1606           1643

It seems to me that I should use the t- or z-test to achieve my goal, but so far I have used them to test statistical difference between population means, not their sizes.

P.S. This is the first question I asked on stackexchange. Any suggestions or tips on how I can improve the question will be welcomed.

Edit: I would like to clarify a few things. I'm running an A/B test for a company which sells software through a website. As I mentioned before the aim of the test is to see if the modified site layout leads to an increased number of purchased licenses. The control and experiment groups were created by randomly assigning a cookie file to each unique visitor upon their first site hit.

I would like to test if number of cookies (visit counts) from the control and experiment group are not statistically different to reduce bias of the experiment (and generally make it more valid).

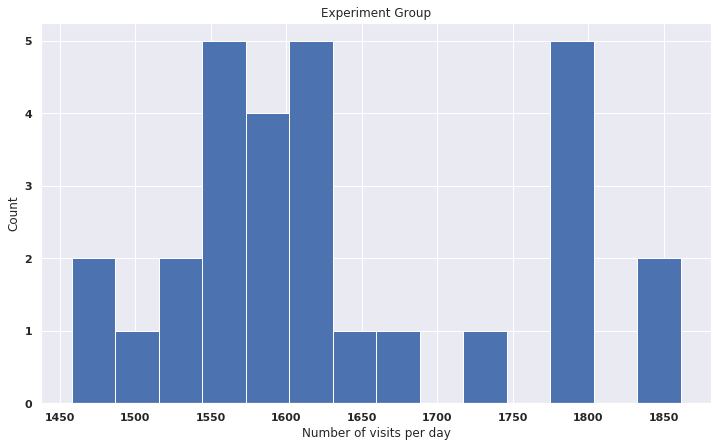
The distributions of the visits for both of the groups are not normal, as shown in the histograms: Control group
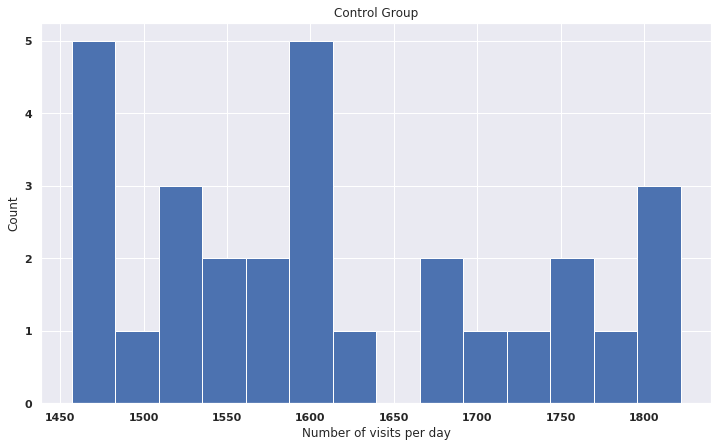
enter image description here

$\endgroup$
7
  • 2
    $\begingroup$ If you randomized the allocation to control vs experimental group, you do not need to do a test because you already know that differences only can appear by chance. see for example this paper tandfonline.com/doi/abs/10.1080/00031305.2017.1322143 $\endgroup$ Commented Aug 5, 2020 at 10:10
  • 1
    $\begingroup$ The trouble with what you propose is that “significance” aids is in drawing a conclusion about the population(s) from which the sample(s) were drawn. Sample size is not a property of the population; the population is the population whether you draw one sample, a bazillion-gazillion samples, or no samples. However, something feels “right” about examining if more people visit one website than the other. The naïve approach would be t-testing (probably paired) the number of visitors. Does that sound about like what you would do? Watch out for the time series nature of your data, however. $\endgroup$
    – Dave
    Commented Aug 5, 2020 at 10:38
  • $\begingroup$ @Dave Yes, t-testing sounds right to me. The problem is I don't know how to use it to assess whether the sizes of the groups are statistically different. Can you show me how to do it or send me some sources to find out more on this subject? $\endgroup$
    – Jedrek369
    Commented Aug 5, 2020 at 10:56
  • 1
    $\begingroup$ I have my own reservations about using paired t-testing, but what do you think about that? $\endgroup$
    – Dave
    Commented Aug 5, 2020 at 11:26
  • 1
    $\begingroup$ Why do you want to look at this (it really helps to be clear about the underlying question)? Are you trying to check whether the engineering team that implemented the A/B test messed up and due to their mistake the A/B test did not randomly assign visitors?! As @00schneider points out if this was properly randomly done, then there's no point in doing this. $\endgroup$
    – Björn
    Commented Aug 5, 2020 at 12:18

1 Answer 1

1
$\begingroup$

I think you may be using the word 'population' incorrectly to refer to the numbers of Control and Experimental visits. You haven't said what triggers either kind of visit or what consequences flow from having essentially equal visits or not.

It is also not clear whether numbers of visits of each type are anywhere near normal. With 29 days of data for each kind of visit, some people might want to be rely on the legendary 'robustness' of t tests. (That means that results of the t test may be useful even if data are not normal. Strictly speaking, you have positive-integer count data, which cannot be exactly normal.

Similarly, without seeing the data, I would be uncomfortable assuming normality and doing a t test. Another choice would be to use a nonparametric Wilcoxon (rank sum) test, which has some assumptions other than to have normal data. (Specifically, interpretation of test results can depend on whether the two distributions have similar shapes.)

So it would help if you could show two histograms of visit counts, one for each group. (If not histograms, then summaries by intervals of counts from which a histogram can be made.

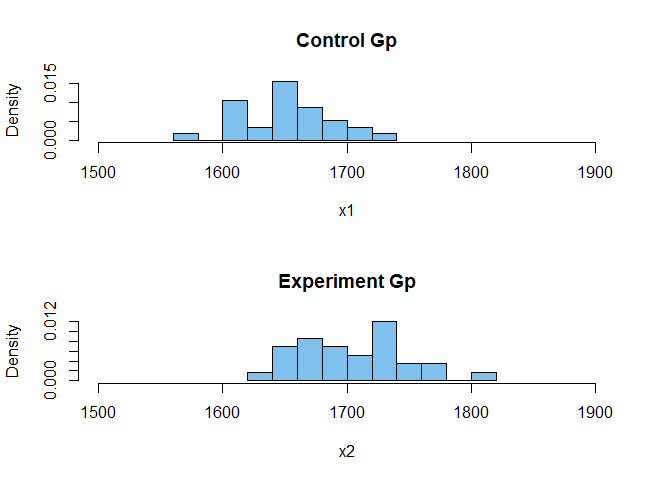
Here are some simulated data for which either a Welch 2-sample t test and a Wilcoxon rank sum test would both be reasonable choicess.

set.seed(805)
x1 = rpois(29, 1650)
x2 = rpois(29, 1700)
par(mfrow=c(2,1))
 hist(x1, prob=T, br=8, xlim=c(1500,1900), col="skyblue2", 
      main="Control Gp")
 hist(x2, prob=T, br=8, xlim=c(1500,1900), col="skyblue2", 
      main="Experiment Gp")
par(mfrow=c(1,1))

enter image description here

For my simulated data, both the t test and the Wilcoxon test show a highly significant differenc between the two groups: both P-value are nearly $0.$

t.test(x1,x2)

        Welch Two Sample t-test

data:  x1 and x2
t = -5.1036, df = 54.249, p-value = 4.396e-06
alternative hypothesis: 
  true difference in means is not equal to 0
95 percent confidence interval:
 -73.96238 -32.24451
sample estimates:
mean of x mean of y 
 1652.103  1705.207 

$\,$

wilcox.test(x1,x2)

        Wilcoxon rank sum test with continuity correction

data:  x1 and x2
W = 145, p-value = 1.89e-05
alternative hypothesis: 
  true location shift is not equal to 0

Warning message:
In wilcox.test.default(x1, x2) : cannot compute exact p-value with ties

Note: For sample sizes as large as 29 and such a small P-value, the Warning about ties can be ignored.

$\endgroup$
5
  • 1
    $\begingroup$ Would you not consider the time series nature of the data? $\endgroup$
    – Dave
    Commented Aug 5, 2020 at 21:28
  • $\begingroup$ That was not explicitly addressed in the Q. If days are in sequence and data are paired, then both tests should be paired tests. Also, the theme that there would be a sign of trouble if groups are different emerged only during your repeated questioning (over about 3 hours it seems) in Comments. // Sometimes I propose a solution showing my exact model with the hope that it will prompt the full story to emerge. $\endgroup$
    – BruceET
    Commented Aug 5, 2020 at 22:04
  • $\begingroup$ @BruceET Thank you for your answer. I edited my question and added more details and histograms. Hopefully it will make my question clearer. $\endgroup$
    – Jedrek369
    Commented Aug 7, 2020 at 10:49
  • $\begingroup$ Should you not do paired t-test or Wilcox test as it is clearly paired data? $\endgroup$
    – rnso
    Commented Aug 7, 2020 at 11:08
  • $\begingroup$ My fake data are not paired, but If I correctly understand your info about cookies, then your data may be paired. Do you have a pair in the Exp group for each subject in the Ctrl group? if so, look at a histogram of paired differences. If far from normally distributed, do paired Wilcoxon (signed-rank) test. $\endgroup$
    – BruceET
    Commented Aug 11, 2020 at 14:46

Your Answer

By clicking “Post Your Answer”, you agree to our terms of service and acknowledge you have read our privacy policy.

Not the answer you're looking for? Browse other questions tagged or ask your own question.