1
$\begingroup$

I'm new to Machine Learning. I have just read an article about basis functions.

Apparently, the basis functions create a non-linear regression line to capture a variety of differently complicated models (quadratic, cubics, etc...). What I saw is that every transformation of new feature made is in the same dimension as in the original input space. For example, the picture below enter image description here
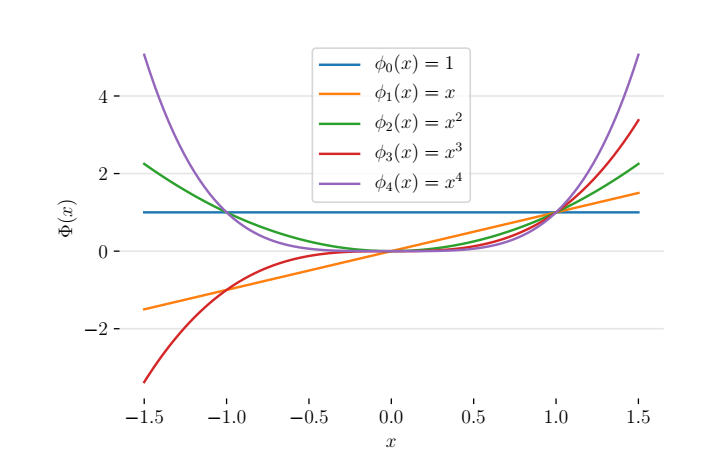
Here the basic function vector has 5 terms: $$ \pmb{\phi}(x) = [\phi_{0}(x), \phi_{1}(x), \phi_{2}(x), \phi_{3}(x), \phi_{4}(x)]^{T} = [1, x, x^{2}, x^{3}, x^{4}]^{T} $$

But in SVM feature mapping, the input will be mapped in a higher-dimensional feature space, like in the above case, the basic function vector contains 5 values so it could be seen as mapping from 1-D input space to 4-D feature space (not including the bias-term $\phi_{0}(x)$).

$$\pmb{\Phi} : [x] \mapsto [x, x^{2}, x^{3}, x^{4}]^{T} $$

So I need someone to provide me with better explanation. From what I understand, basis function break the linearity by transforming linear function to non-linear one. Whereas, feature map finds a hyperplane in high-dimensional space that can separate the data well. However, both these concepts seem to revolve around vector of basis functions $\pmb{\phi}$...

$\endgroup$

2 Answers 2

1
$\begingroup$

A basis function is a feature mapping. What an SVM does differently is that it introduces kernel functions to more easily work with basis functions (feature mappings)

A kernel is a shortcut to compute the inner-product between basis functions (feature mappings). What a basis function does is to transform the space in a nonlinear way so as to capture more information about the data.

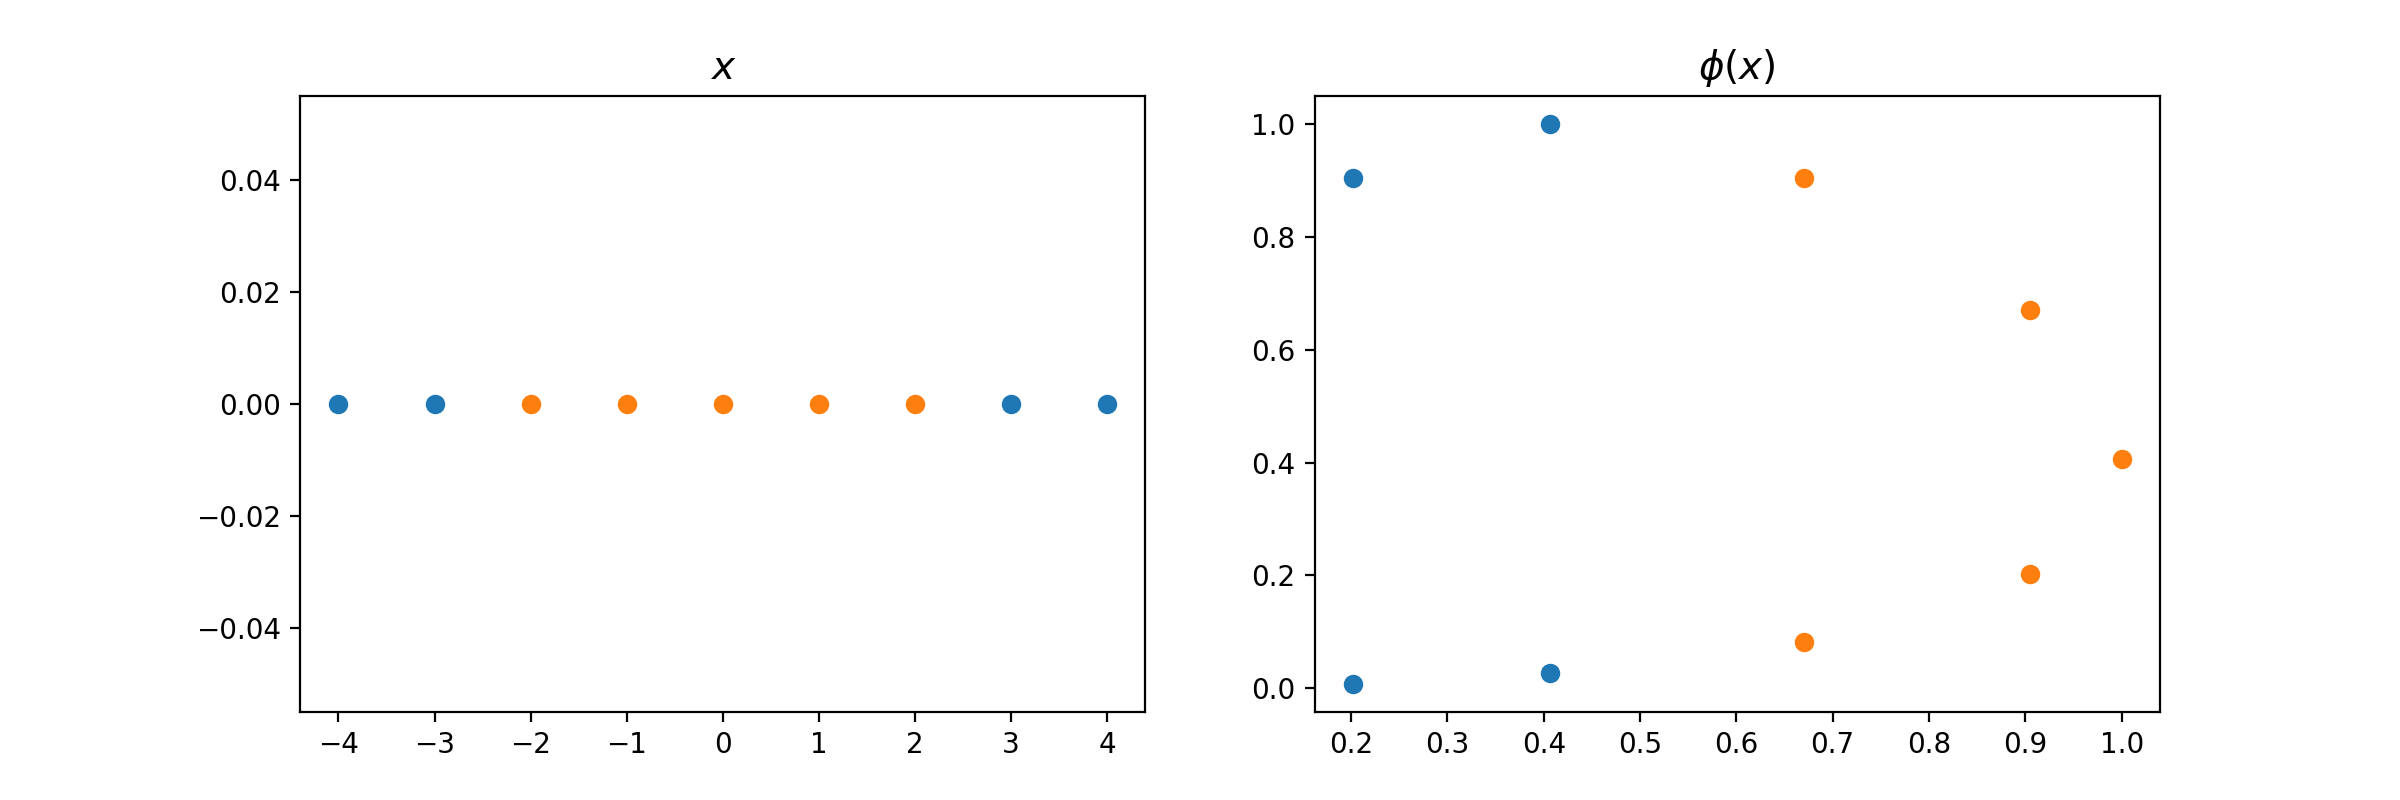
In the following example, note how $x$ lives in the real numbers, but I can find some transformation of $x$ that makes it live in $\mathbb{R}^2$. That's all a basis function does.

basis function

To understand the role of basis functions, imagine we have a basis function $\phi:\mathbb{R} \to \mathbb{R}^L$. For any $x,y\in\mathbb{R}$ that you give me, in order to compute the inner product $\phi(x)^T\phi(y)$, I need to first compute $2L$ new values ($L$ for $\phi(x)$ and $L$ for $\phi(y)$), and then multiply their entries one by one, thus giving me their inner product.

But, what happens if $L$ is big. In fact, what happens if $L = \infty$? (making abuse of notation here). In this case, it does not matter how much computational power we have, we will never be able to to compute their inner product. Here is where kernels come into play.

What we would like is to have a way to compute $\phi(x)^T\phi(y)$ without the need to explicitly transform the space and then get the inner product. And we can actually do so! Denoting

$$ K(x,y) = \phi(x)^T\phi(y) $$

as a kernel function, we can try to find a function that returns $\phi(x)^T\phi(y)$ without the explicit steps mentioned above.

Coincidentally, in an SVM you don't really care about who is $\phi(x)$ (your basis function; feature mapping), but rather who is $\phi(x)^T\phi(y) = K(x, y)$.

$\endgroup$
2
  • $\begingroup$ Thank you. I grasped the idea behind the kernel trick. Still, I wonder about the plot you showed. Is $ \phi(x) \in R^{2}$ or $ R^{3}$? Say, if $ \phi(x) = [1, x^{2}]^{T}$ or $\phi(x) = [1, x, x^{2}]^{T}$, which one can illustrate the above quadratic relationship? $\endgroup$ Commented Aug 16, 2020 at 11:03
  • $\begingroup$ The graph i showed is a mapping $\phi: \mathbb{R}\to \mathbb{R}^2$. The particular choice of mapping is not relevant. $\endgroup$ Commented Aug 16, 2020 at 12:39
0
$\begingroup$

Paraphrasing substantially from Bishop (see chapters 3 and 7):

Linear basis function models extend linear regression models by allowing combinations of non-linear functions,

$$y(x,w) = \sum w\Phi(x)$$

where w are the weights and $\Phi$ are the basis functions.

The output of $y(x,w) $ is therefore a non-linear function of $x$, but these are still called linear models because the model is linear in the parameters $w$.

If I understand the maximum margin classifiers section correctly, SVMs are using linear basis function models to map the data to a higher space, as you note, and are then also incorporating a decision boundary to separate the classes.

$\endgroup$

Your Answer

By clicking “Post Your Answer”, you agree to our terms of service and acknowledge you have read our privacy policy.

Not the answer you're looking for? Browse other questions tagged or ask your own question.