0
$\begingroup$

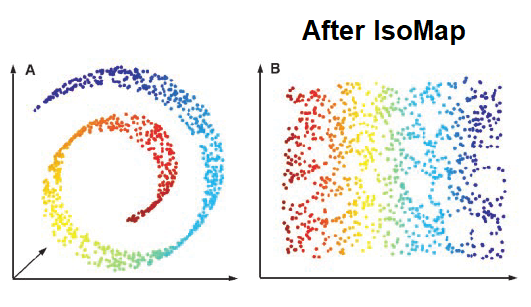
So I've just started a project which includes some metric learning, and came accross this swiss roll in 3D to 2D problem. Ideally, you should 'unroll' the roll.

enter image description here

My question is, can this be extended to higher dimensions? As in is there any other way of validating a metric learning technique where we know the structure in higher dimensional data and so we can have some sense of the structure in lower dimensions?

The one other example I can think of is concentric n-spheres, but even then I don't know any dim-reduction technique that would help.

$\endgroup$
1
  • $\begingroup$ welcome to CV. Each point in the 2d roll has location coordinate (x,y). In this case they are created with polar form, and then translated to cartesian. x = r * cos(theta). You can make an n-dimensional spherical coordinate system where r is changing and you are sweeping your angles, then convert to an n-dimensional cartesian coordinate. $\endgroup$ Commented Sep 25, 2020 at 15:16

1 Answer 1

1
$\begingroup$

There is nothing special about dimensionality reduction in moving from 3 dimensions to 2 - dimensionality reduction, in principle, can start with an arbitrarily large number of dimensions. You could extend the Swiss Roll to higher dimensions by simply imagining several instances of plot A, where each dimension in/out of the plane of the screen represents a different uninformative dimension. You'd have a N dimensional Swiss Roll dataset which you can visualize as N-2 three-dimensional plots, but the underlying manifold is still well-described in far fewer dimensions. No matter how many uninformative dimensions you have, you can still get back to something like plot B with the right mapping.

For concentric N-spheres, the ideal dimensionality reduction would map everything to one dimension, which simply measures the radius. You only need one single number to determine which N-sphere you're in, which is the distance from the center.

$\endgroup$
4
  • $\begingroup$ Even if there is some noise around the surface of the sphere, giving the distance from the point to the center of the spheres should create clusters around the radii. $\endgroup$
    – Dave
    Commented Sep 25, 2020 at 15:25
  • $\begingroup$ @Dave Indeed, in practice, I'd say it's uncommon for a dimension to be completely uninformative, as there will typically be at least some variability (even if just noise) with respect to some target variable. You'll usually lose at least a little variability in the data by discarding dimensions, but so long as we retain most of the signal in the dimensions we keep (like the radius in the noisy concentric spheres), dimensionality reduction has done its job. $\endgroup$ Commented Sep 25, 2020 at 15:30
  • $\begingroup$ "You'd have a N dimensional Swiss Roll dataset which you can visualize as N-2 three-dimensional plots, but the underlying manifold is still well-described in far fewer dimensions." Could you expand a bit more on that? What do you mean by a N-2 three dimensional plot? Im not sure how you could add a uninformative dimension by imagining several instances of the roll. $\endgroup$
    – Wingmore
    Commented Sep 26, 2020 at 4:08
  • $\begingroup$ @Wingmore I'm saying you can visualize a higher dimensional dataset as a series of 3D plots. Suppose dimensions 1 and 2 are informative, 3 through N are not. You can plot the Swiss Roll in dimensions {1, 2, 3} or {1, 2, 37} or {1, 2, N} and it'll look basically the same. With any number of dimensions, though, it's still just a matter of finding the right dimension to unroll. $\endgroup$ Commented Sep 28, 2020 at 12:46

Your Answer

By clicking “Post Your Answer”, you agree to our terms of service and acknowledge you have read our privacy policy.

Not the answer you're looking for? Browse other questions tagged or ask your own question.