13
$\begingroup$

I have a data set containing the number of actions performed by individuals over the course of 7 days. The specific action shouldn't be relevant for this question. Here are some descriptive statistics for the data set: $$ \begin{array}{|c|c|} \hline \text{Range} & 0 - 772 \\ \hline \text{Mean} & 18.2 \\ \hline \text{Variance} & 2791 \\ \hline \text{Number of observations} & 696 \\ \hline \end{array} $$

Here is a histogram of the data: action histogram
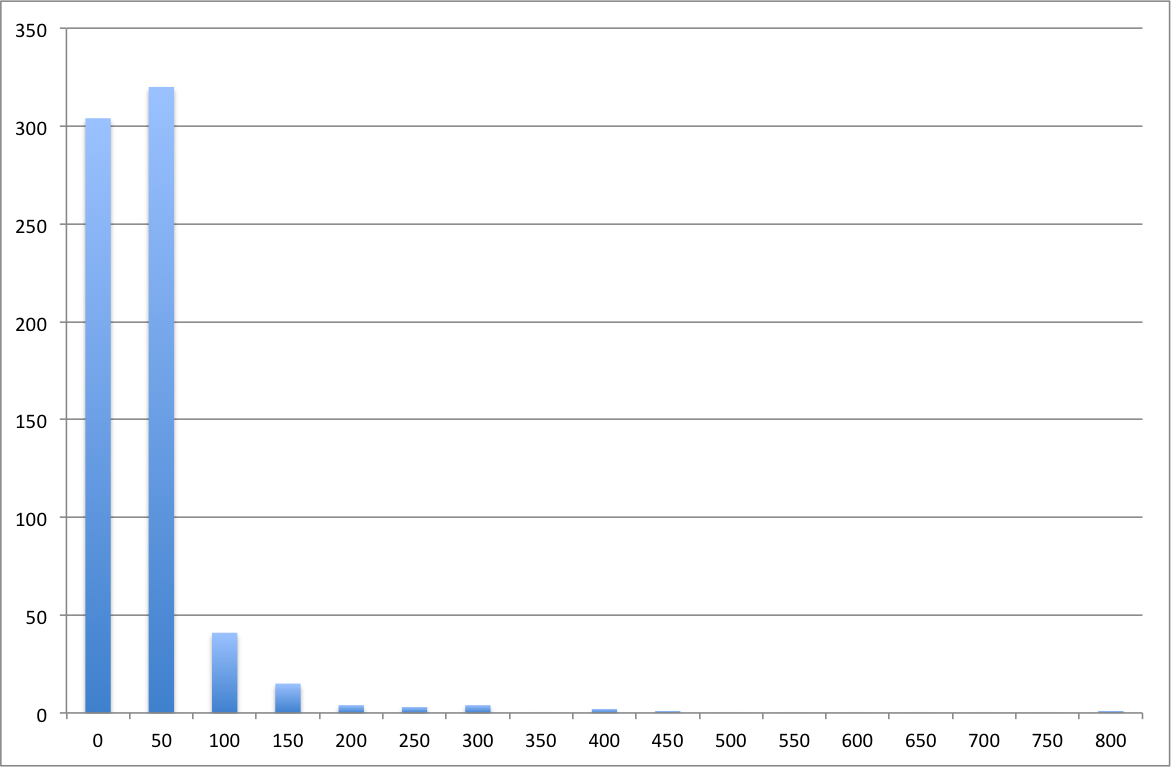
Judging from the source of the data, I figured it would fit a Poisson distribution. However, the mean ≠ variance, and the histogram is heavily weighted to the left. Additionally, I ran the goodfit test in R and got:

> gf <- goodfit(actions,type="poisson", method = "MinChisq") <br>
> summary(gf) <br>
Goodness-of-fit test for poisson distribution <br>
X^2                   df         P(> X^2) <br>
Pearson 2.937599e+248 771        0  

The Maximum Likelihood method also yielded p-value = 0. Assuming the null hypothesis is: the data matches a Poisson distribution (the documentation doesn't specify this), then the goodfit test says we should reject the null hypothesis, therefore the data does not match a Poisson distribution.

Is that analysis correct? If so, what distribution do you think will fit this data?

My ultimate goal is to compare the mean number of actions between 2 samples to see if the means are different; is checking the distribution even necessary? My understanding is the typical tests (z-,t-,$\chi^2$ tests) don't work for Poisson distributions. What test should I use if the data is indeed Poisson-distributed?

$\endgroup$
5
  • $\begingroup$ have you tried negative binomial already? Did this help? $\endgroup$
    – Richi W
    Commented Feb 1, 2013 at 11:51
  • $\begingroup$ @Richard, I tried negative binomial, and that didn't fit. Thanks for the suggestions though. Since I couldn't figure out what kind of distribution this was, I decided to ignore the distribution and go with a non-parametric test, the Mann-Whitney U test. $\endgroup$
    – Dcook
    Commented Feb 7, 2013 at 4:06
  • $\begingroup$ Just one more remark for neg bin. In en.wikipedia.org/wiki/Negative_binomial_distribution you see the formula for mean and the variance and that $mean/variance = 1-p$. Such a $p$ would this make any sense? If not then there is even more evidence that neg bin is not a good model here (if we believe in the moment estimators). $\endgroup$
    – Richi W
    Commented Feb 7, 2013 at 9:07
  • $\begingroup$ I don't think the concept of a Bernoulli trial applies in my case. There's no concept of success or failure; subjects either execute the action of interest or they don't. They don't try and fail. Therefore, the idea of a probability of success doesn't make sense. Unless the trial is a unit of time. But then there's nothing to prevent the subject from executing multiple actions in that time period. $\endgroup$
    – Dcook
    Commented Feb 7, 2013 at 23:00
  • $\begingroup$ you know best how to interpret your data. I just wanted to remind you that neg.bin. arises as a Poisson mixture (if $lmabda$ follows a Gamma-distribution. Thus one can interpret in a similar way as in the Poisson case. But I don't want to force you :). One more comment: if the subject can execute multiple actions in one time point: can't it be Compound Poisson/NegBin then? Please tell me if you want more remarks on that. $\endgroup$
    – Richi W
    Commented Feb 8, 2013 at 8:32

5 Answers 5

8
$\begingroup$

If variance is greater than the mean then this is called over-dispersion. A natural model for this is the negative binomial distribution. This can also be seen as a Poisson distribution where the Parameter lambda follows a Gamma distribution. A first and easy step could be to fit a negative binomial distribution.

$\endgroup$
6
$\begingroup$

If your raw count data doesn't look like a Poisson distribution, then you are missing something. Perhaps the number of actions is dependent on the temperature, so on hot days people do fewer things. Then temperature variation over your study period would affect the distribution and make it non-Poisson.

However, the number of actions each day could still be Poisson with a mean dependent on the temperature. If you have the temperature each day, then you can do a GLM, regressing number of actions as a Poisson variable, dependent on temperature. If that fits nicely, job done.

If you don't have possible explanatory variables, then all you can say is "something else is going on - the number of actions is not from independent Poisson samples" - ie reject your null hypothesis.

There are distribution-free tests that can compare paired observations by using rankings and so on. Typically they do large numbers of permutations and compute a test statistic...

$\endgroup$
4
$\begingroup$

One more thing: You should investigate outliers in count data too. You've got one count at 400-ish & then nothing till 800-ish. That's not likely to be fit by any of the common models.

$\endgroup$
2
$\begingroup$

I suspect that your histogram is binned deceptively. If you have a little over 300 observations evenly spread throughtout the range 0-50, about 320 evenly spread throughout the range 50-100, and 50 or more above 100, your mean ought to be substantially larger than 18.2.

If the data in the range 0-50 are not evenly spread but concentrated near zero, then seeing more in the 50-100 range than in the 0-50 range is surprising.

Perhaps you have a mixture of distributions. I doubt that anyone can do a lot with this without the actual 696 observations and especially without knowing more about the context. Is each of the 696 observations an individual and is the response the number of actions each individual took? If so, are there different types of individuals in the data?

$\endgroup$
1
$\begingroup$

You seem to be counting the number of zero events - if so, then you might consider a ZIP model (or Hurdle) - refer Regression Models for Count Data in R by Zeileis et al for an overview.

To roughly summarise, these methods model the zero counts separately from the rest of the counts which might be useful in your case.

Refer the pscl package and the zeroinfl() and hurdle() functions.

$\endgroup$

Your Answer

By clicking “Post Your Answer”, you agree to our terms of service and acknowledge you have read our privacy policy.

Not the answer you're looking for? Browse other questions tagged or ask your own question.