0
$\begingroup$

I have two different samples I need to test if they are drawn from the same population distribution. The two samples are of the volatility of an asset that I simulated. Since the data is simulated I know that both samples have the same data generating process. The only difference between the two samples are the days that I am using from the simulation.

A summary of the two samples is given below. It is also important to note that since this is simulated data the sample size is quite large. I have 249,281 observations in sample 1 and 254,453 in sample 2.

> summary(Sample1)
   Min. 1st Qu.  Median    Mean 3rd Qu.    Max. 
 0.0128  0.0894  0.1194  0.1367  0.1627  0.9925 
> summary(Sample2)
   Min. 1st Qu.  Median    Mean 3rd Qu.    Max. 
 0.0141  0.0950  0.1263  0.1467  0.1724  1.1435 

When I apply the Kolmogorov-Smirnov test the results reject the null hypothesis that the two samples are drawn from the same population.

ks.test(Sample1,Sample2)

    Two-sample Kolmogorov-Smirnov test

data:  Sample1 and Sample2
D = 0.053089, p-value < 2.2e-16
alternative hypothesis: two-sided

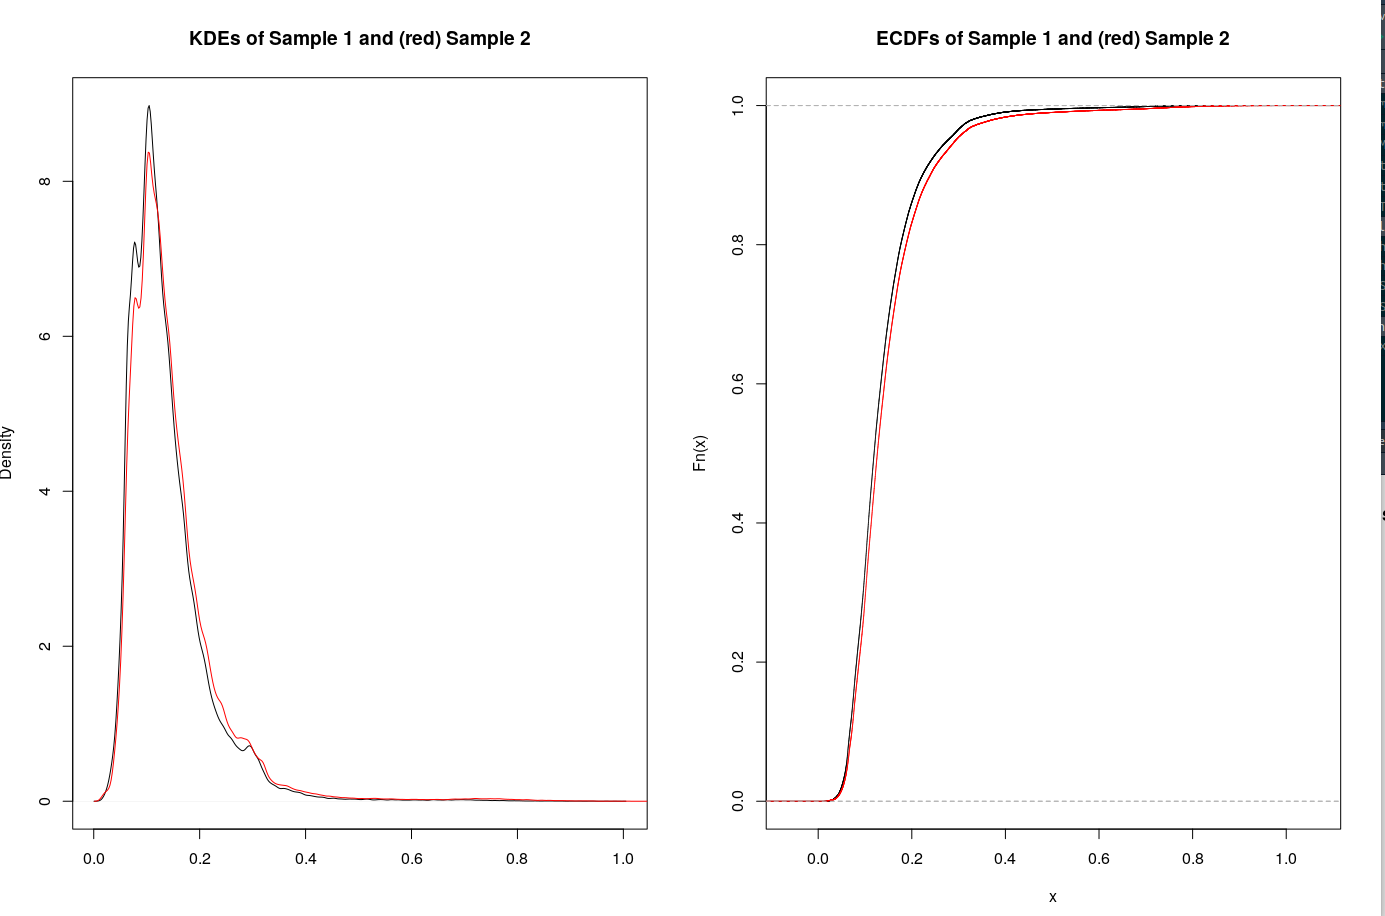
However if I plot the kernel approximation of the two different density functions and the CDF both of the samples appear to be from the same distribution. A copy of the plots is given below. enter image description here How is it possible that the two samples come from different distributions if they have the same data generating process? Am I missing interpreting the results from the KS test? Is there another test that I should be apply?
$\endgroup$
1
  • $\begingroup$ Try the simulation 1000 times. If you set $\alpha=0.05$, you should reject about $5\%$ of the time. If you're much different from that, then perhaps your simulation isn't as correct as you think. $\endgroup$
    – Dave
    Commented Oct 7, 2020 at 22:07

1 Answer 1

1
$\begingroup$

The KS test is based on the CDF, so it's telling you that the small vertical differences between the two CDFs are much larger than you'd expect in 250,000 independent observations from the same distribution. The expected differences would be on the order of 0.001, and yours are more like 0.01.

It sounds as though your data generating process generates data with slightly different distributions on different days. Or the observations are not independent and the effective sample size is about 1% of the actual sample size.

$\endgroup$
2
  • $\begingroup$ Thomas, thank you for your comment. The observations with in each sample are not independent from one another. On any given day the asset price was used to calculate the implied volatility over a one day period, then a two day period, all the way up to a 75 day period. Therefore, all observation on the same day will be correlated with each other. However, since different days where used in each sample I believe the two samples should be independent of one another. Does this violate the assumptions of the KS test? Is there another test that I should use? $\endgroup$
    – BenAlbert
    Commented Oct 9, 2020 at 13:59
  • $\begingroup$ Yes, it is necessary that the observation in each sample are independent of each other. $\endgroup$ Commented Oct 15, 2020 at 22:29

Your Answer

By clicking “Post Your Answer”, you agree to our terms of service and acknowledge you have read our privacy policy.

Not the answer you're looking for? Browse other questions tagged or ask your own question.