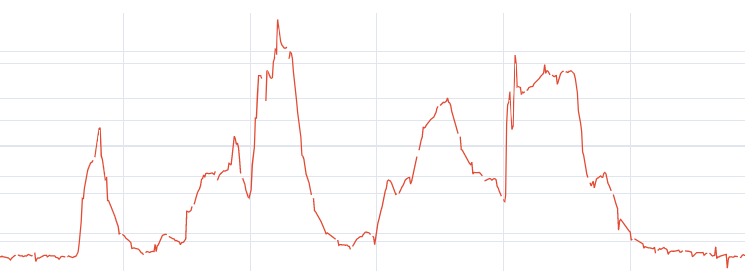
I have a dataset which contains minute level sensor measurements. Sample is shown here:

To me useful information are these peaks in time series, mostly their peak and duration. My idea is to take out only windows with each peak and then to cluster them to a few typical peaks. Problem is how to determine window size since they have different duration and they start at a different time each day.
I would like to get this, where each colour on the image is an array containing only the values and timestamp of that peak:
I am thinking of SAX, where I would need some methodology to cut the sequence when the value gets to low (normal), e.g. abbbccdcbbbbaaaaabbbbcbbaaaa, would be cut to abbbccdcbbbba and abbbbcbba. But maybe there is other, better way.

