1
$\begingroup$

I have a base MLR model of data that has 8 numeric predictors and 3 categorical predictors. The response is whole number numeric values.

My base model has some mild regression assumption violations (non-normality of residuals shown below) so I tamed them by utilizing a log10 transform. enter image description here
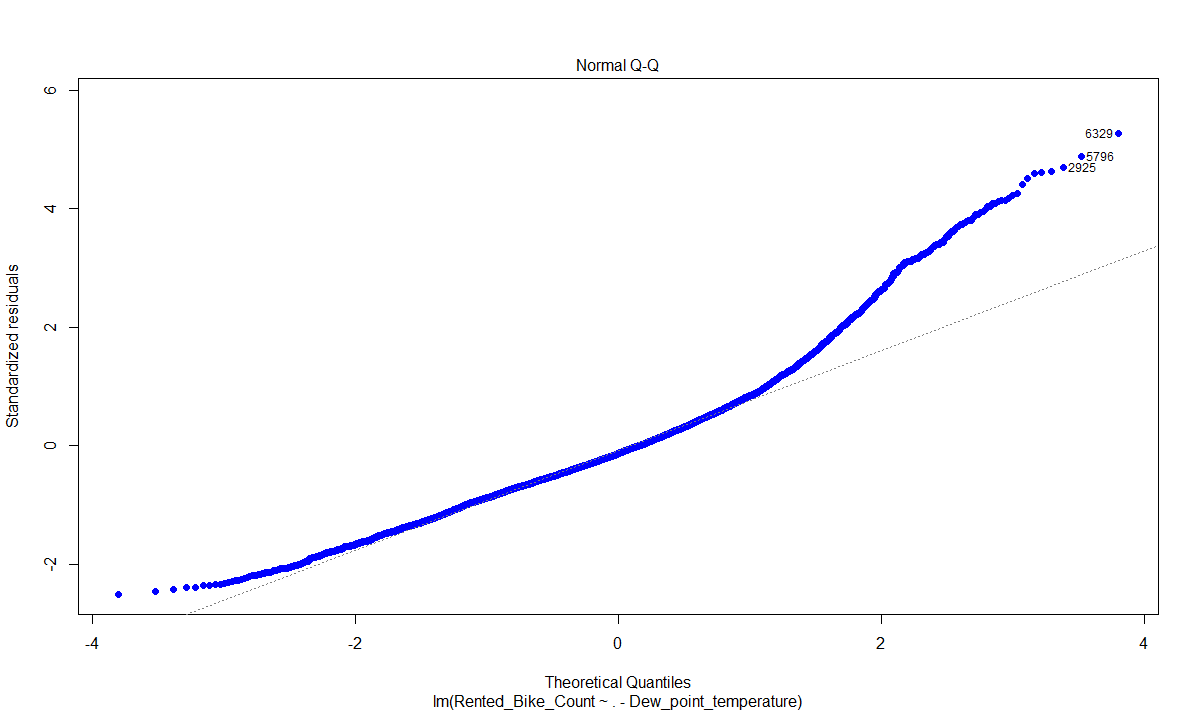
I transformed the response as well as the numeric variables and left the categorical predictors alone. I also offset each predictor by 1 + min(that variable) to get around any sort of NAs that are results of the log10 transform (for negative values).

Now my goal is to compare the MSE from this model to other future models (Random Forest, SVM, Regularized Regression, etc.). I want to be able to compare this model's MSE to other models (that don't use transformations). So I need to get the residuals in terms of original units.

How exactly would I go about doing so? The inverse of y = log10(x) is of course 10^y = x but how can I do this with the model's $residuals to get the residuals in non-transformed units? Since some of my variables are categorical how does this effect my un-transformation?

# R Code for MLR model
mlr_fit_3_log <- lm(log10(Rented_Bike_Count + 1 - min(bike2$Rented_Bike_Count)) ~ 
                    log10(Hour + 1 min(bike2$Hour)) +
                    log10(Temperature + 1 - min(bike2$Temperature)) + 
                log10(Humidity + 1 - min(bike2$Humidity)) +
                    log10(Wind_speed + 1 - min(bike2$Wind_speed)) +
                log10(Visibility + 1 - min(bike2$Visibility)) +
                    log10(Solar_Radiation + 1 - min(bike2$Solar_Radiation))+
                log10(Rainfall + 1 - min(bike2$Rainfall)) + 
                    log10(Snowfall + 1 - min(bike2$Snowfall)) +
                    Seasons + # factor
                    Holiday + # factor
                    Functioning_Day # factor 
                    - Dew_point_temperature, data = Train_set)

# Calculate MSE  model
mse <- function(fit_obj){
  mean(fit_obj$residuals^2)
}
$\endgroup$
2
  • $\begingroup$ Please say more about why your "goal is to compare the MSE from this model to the untransformed model." If the untransformed model didn't satisfy the linear regression assumptions but the transformed one did, what do you hope to gain from evaluating the untransformed model further? Please edit your question to provide this information, as comments are sometimes overlooked by visitors to this site and comments can sometimes be lost. $\endgroup$
    – EdM
    Commented Oct 30, 2020 at 20:04
  • $\begingroup$ @EdM I wouldn't say the assumptions were strongly violated in the original but I decided to do the transformation anyways. It is just an "in general" question of how to compare a transformed model to an untransformed model by getting the residuals back to the un-transformed units. $\endgroup$
    – Coldchain9
    Commented Oct 30, 2020 at 20:07

1 Answer 1

2
$\begingroup$

You can't really make that comparison in a useful way, as the results of the two models are on different scales. This might be easier to think about with a continuous outcome variable rather than a count variable like you have. Say your outcome variable was instead the number of dollars spent on renting bikes, taking into account both the number rented and the cost per hour of rental.

If you use the number of dollars as the outcome variable, the square root of the MSE will also be in dollars. Logarithms, in contrast, are unitless. When you take the log of the number of dollars as an outcome variable, you are really modeling the log of the ratio of the number of dollars to a single base unit of 1 dollar. That's explained nicely here in the context of distances. As a result, the square root of the mean square error represents something related to fractional errors in your predictions rather than absolute errors. You could perhaps choose some illustrative representative examples, but there is no unique relationship between the two measures of MSE that would be very useful to a reader.

In terms of your particular application, instead of jumping through the hoops you devised to formulate your model (taking differences between actual and minimum values of counts, adding 1 to avoid taking the log of 0, etc), you probably would be better off modeling the counts directly with a generalized linear model, like a Poisson regression with a log link function. Also, a log transform of the outcome variable (or a generalized model with a log link) doesn't necessarily require logarithmic transformations of the predictors. Transformation of predictors should be done to ensure that the net linear predictor (sum of predictors weighted by their coefficients) is linearly related to the (generalized) outcome. Whether log transforms of predictors helps with that depends on the situation.

$\endgroup$
4
  • $\begingroup$ Excellent answer. Thank you for this. I do have some experience with GLM in the past but for this project I am trying to compare multiple models (MLR, Random Forest, SVR, etc.). So my issue is that it is hard to compare the model's individual MSEs to eachother to see the better performance.. Perhaps there is another way to compare them? $\endgroup$
    – Coldchain9
    Commented Oct 30, 2020 at 20:53
  • $\begingroup$ @Coldchain9 if you care mostly about fractional errors, do everything in log scale. Or try a square-root transformation, which can work well with counts, for all models. Otherwise, consider the costs of the errors integrated over a set of predictions on scenarios that represent your practical application. If an error of +/-1 count has the same cost at a predicted count of 2 as it does at a predicted count of 20, get predictions from the log-transformed model, back-transform the fractional errors to count scale for each prediction, and integrate (add them up) over your scenarios. $\endgroup$
    – EdM
    Commented Oct 30, 2020 at 21:59
  • $\begingroup$ Ok, great. I realized that just log10() of my response was enough to fix normality assumptions so in theory I could just take the inverse of my fitted values and get the MSE for the model that way (in terms of normal units). This is at least a simple fix, correct? $\endgroup$
    – Coldchain9
    Commented Oct 30, 2020 at 23:08
  • $\begingroup$ @Coldchain9 yes, but there's a potential bias unless this training set matches your population of interest well. In the log scale the fractional errors are constant, so the absolute errors are larger for higher predicted values. The mean-square error after back-transformation from log scale thus depends on the distribution of predicted values. If in application the distribution of predicted values differs from this training set, the expected mean-square error would differ, too. So comparisons of count-level MSE among models on this training set might not be the same in practice. $\endgroup$
    – EdM
    Commented Oct 31, 2020 at 2:30

Your Answer

By clicking “Post Your Answer”, you agree to our terms of service and acknowledge you have read our privacy policy.

Not the answer you're looking for? Browse other questions tagged or ask your own question.