2
$\begingroup$

I'm dealing with binary events and I've got people guestimating the chance that they occur. I'd like to translate someone else's guestimate into a probability distribution representing my belief about the true probability. This is called a posterior distribution right? basic bayesian stats?

I imagine I want a distribution which looks roughly normal and fairly wide for a forecast of 0.5 but becomes increasingly skewed for forecasts closer to the tails.

At the moment I don't have data, I'm just doing exploratory simulations. I'm looking for an R function to that takes a probability forecast and outputs a probability distribution with reasonable parameters.

Added: For my purposes, even a very very rough approximation will do. Its perfectly fine if statistically literate people roll their eyes. But R code to get me started would be greatly appreciated.

Added: I fear I still wasn't clear enough about my weird situation. My "expert" is actually only telling me their single best guess for the binary event occurring. I've seen (but not recorded) a bunch of the expert's past best guesses so I have an intuitive sense for what the true distribution of the probability of the events are conditional on an expert's best guess. So I guess I need to play around with beta distribution parameters. Find the parameters that I like for a 0.5 forecast, a 0.25 forecast, 0.1, 0.05 and 0, and then find some smooth functions to interpolate my guesses at what the parameters alpha and beta should be for the space between?

$\endgroup$
5
  • $\begingroup$ Are you confusing prior with posterior? $\endgroup$
    – Glen_b
    Commented Feb 11, 2013 at 1:10
  • $\begingroup$ @Glen_b, perhaps. The way I was thinking about it is that the output/distribution I'm looking for is what I get after updating on the basis of one observation, that's why I guessed that it might be called a posterior. But you think the better way to think about it is that the distribution I'm looking for is my prior? While the focus of my question is about how to get what I want, I do appreciate these conversations about how to talk about what I want! Maybe I should just leave the bayesian language out of this :) $\endgroup$ Commented Feb 11, 2013 at 3:44
  • 1
    $\begingroup$ Well, if you're talking about belief before the data, it's a prior, while updated belief after the data is the posterior. If you get some data and then some more data, then in between your belief can be both (posterior in respect of the first lot of data, prior in respect of the second). $\endgroup$
    – Glen_b
    Commented Feb 11, 2013 at 3:46
  • $\begingroup$ good, that confirms I'm no more ignorant than I thought I was. $\endgroup$ Commented Feb 11, 2013 at 3:51
  • 2
    $\begingroup$ A similar setup is actually treated in most introductions to Bayesian statistics. The beta distribution is used because it is self-conjugate, i.e., if you parameterize your prior belief about the probability of the event occurring by an appropriate beta and then update your belief through experiments, the updated posterior distribution will again be a beta, albeit with different parameters. See, e.g., here: ccrma.stanford.edu/~jos/bayes/bayes.pdf $\endgroup$ Commented Feb 11, 2013 at 9:11

2 Answers 2

5
$\begingroup$

To expand on @Glen_b's answer. A beta distribution is the standard answer here, although it should be noted that it is possible (and also not uncommon) to not try to smooth/model the prior distribution at all but just use some raw point estimates... putting that aside, let us say you think the probability of an occurance can be anywhere between 0 and 1 but you have an expert guess of the chance of that probability being correct for each of 0.1, 0.2, etc. That is, your expert (perhaps you) thinks the chance that that probability is 0.1 is only 0.01; the chance it really is 0.2 is 0.015, and so on.

You can use the method of moments as neatly set out for you in the Wikipedia article on the beta distribution. Here is some code to get you started:

expert <- data.frame(
    probs=1:9/10, 
    prior=c(.01,.15,.3,.2,.14, .1,.05,.04,.01)
)

sum(expert$prior) # check equal to 1

That is, the prior estimates of the chance of each probability are:

> expert
  probs prior
1   0.1  0.01
2   0.2  0.15
3   0.3  0.30
4   0.4  0.20
5   0.5  0.14
6   0.6  0.10
7   0.7  0.05
8   0.8  0.04
9   0.9  0.01

So now to use the method of moments to turn this into a beta distribution that can summarise it:

u <- with(expert, probs %*% prior)
v <- with(expert, ((probs-u)^2) %*% prior)

alpha <- u* (  (u*(1-u)) /v  -1)
beta <- (1-u) * (( u*(1-u))/v-1)

x <- 0:1000/1000

png("beta and point estimates.png", 400,400, res=72)
    plot(x, dbeta(x, alpha, beta), type="l", bty="l", ylim=c(0,3), 
        ylab="Density", xlab="Probability",
        main="Original expert point estimates,\nand beta distribution")
    with(expert, points(probs, prior*10))
dev.off()

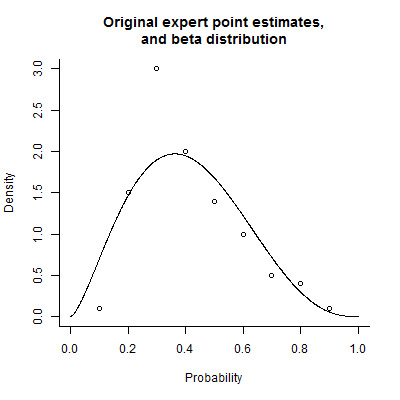
You can see from the image below that the beta distribution is an ok summary of the expert's opinion but it isn't quite the same - basically, the expert's view on the chance of 0.3 being the true probability are a bit of a spike in their prior distribution.

enter image description here

From here you can use Bayesian techniques to confront your prior distribution with the likelihood of the actual data, and hence produce a posterior distribution that combines the two.

$\endgroup$
3
  • $\begingroup$ Thanks Peter! This is helpful, though I fear I fear I still wasn't clear enough... My "expert" is actually only telling me their single best guess for the binary event occurring. I've seen (but not recorded) a bunch of the expert's past best guesses so I have an intuitive sense for what the true distribution of the probability of the events are conditional on an expert's best guess. $\endgroup$ Commented Feb 12, 2013 at 18:27
  • $\begingroup$ So I guess I need to play around with beta distribution parameters. Find the parameters that I like for a 0.5 forecast, a 0.25 forecast, 0.1, 0.05 and 0, and then find some smooth functions to interpolate my guesses at what the parameters alpha and beta should be for the space between? $\endgroup$ Commented Feb 12, 2013 at 18:28
  • $\begingroup$ If you have a single best guess, use that point as the mean of your beta distribution ("u" in my code above) and play around with different variance values (my "v") until you get a shape you think is plausible. This is probably easier than working immediately with the parameters of the beta disribution. So you can start with my code straight from where it calculates alpha and beta given the values of u and v. $\endgroup$ Commented Feb 12, 2013 at 18:45
1
$\begingroup$

I suspect something like a beta distribution might serve your needs. It's often used to model probabilities.

$\endgroup$
4
  • $\begingroup$ Thanks Glen, I had considered the beta... I guess I'm a bit stuck on how to turn this vector of probability forecasts into parameters for the beta. $\endgroup$ Commented Feb 11, 2013 at 3:54
  • 1
    $\begingroup$ if you have some notion of location and spread there (like mean and standard deviation) you could perhaps use moment matching or some equivalent. $\endgroup$
    – Glen_b
    Commented Feb 11, 2013 at 3:59
  • $\begingroup$ oh, when I speak of multiple probability forecasts, they are independent. I only have one data point for each forecasting problem. $\endgroup$ Commented Feb 11, 2013 at 15:25
  • $\begingroup$ There is nice work on this page that is helpful to me too; I would just add that you need to choose whether the prior will represent your own opinion, your expert's, or both combined. (I'm reacting to "I'd like to translate someone else's guestimate into a probability distribution representing my belief.") $\endgroup$
    – rolando2
    Commented Feb 12, 2013 at 18:58

Your Answer

By clicking “Post Your Answer”, you agree to our terms of service and acknowledge you have read our privacy policy.

Not the answer you're looking for? Browse other questions tagged or ask your own question.