Relationship between reproduction number $R(t)$ and growth-rate $C(t)$
The growth rate $C(t)$ and the $R(t)$ are very much related.
$C(t)$ is the growth rate per unit of time. It indicates how fast the infections multiply.
(doubling time is related to growth rate see as the inverse: How to calculate the doubling rate for infections?)
$R(t)$ is the factor by which each generation multiplies. It indicates by how much new infections occur for each infected person.
The reproduction rate $R$ tells by which factor the infections multiply each step. But it is not a rate of growth with just different units (per generation instead of per time) because simultaneously infected people will heal or die and the net growth needs to account for those two effects together.
So $R(t)$ tells a slightly different story than growth rate. In terms of the SIR compartmental model you can consider two rates: $\beta$ the rate by which new infectections occur, and $\gamma$ the rate by which infections disappear (due to healing or death). The (net) growth rate is the difference of these two $C= \beta -\gamma$. The reproduction rate is the ratio of these two $R = \beta/\gamma$.
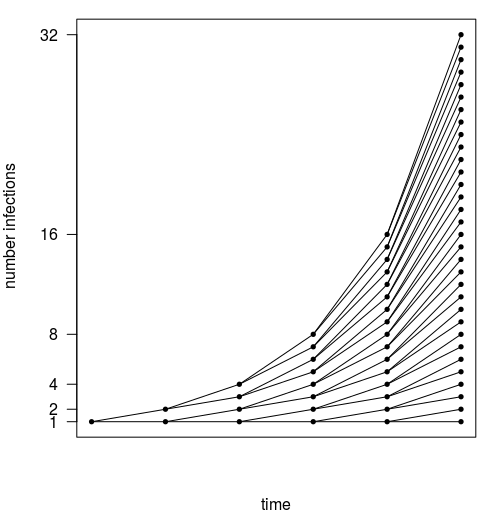
In the image below you see a schematic for the growth. The nodes represent infected people and from each node, we draw lines to people that will be infected next. In this example, every infected person will infect two new people.
The reproduction rate $R(t)$ is the number of links for each node. It represents a multiplication factor in a chain reaction.
The growth rate $C(t)$ (how fast this curve rises in time) will depend on the time in between each generation.
If you know $C(t)$, then you do not yet know the underlying structure of the chain reaction. This structure of the chain reaction (summarized/simplified by $R(t)$) may be essential in understanding the mechanism and dynamics of the spread (and how it responds to environmental changes like vaccination/immunity or social distancing).

If you know $\tau$ the time between infections (which can be viewed differently e.g. serial interval or generation interval) then you can relate the reproduction number with the growth rate
$$ C(t) = \frac{R(t)-1}{ \tau }$$
or
$$ R(t) = 1 + C(t) \tau$$
There are other relationships possible for more complicated models. The point is mainly that you do not get a simple difference by a scale factor $C(t) = \frac{R(t)}{ \tau }$. The $-1$ term occurs because you do not only have growth/reproduction but also decrease due to people becoming better or dying.
A standard work explaining how to relate the growth rate and the reproduction number is "How generation intervals shape the relationship between growth rates and reproductive numbers" from Wallinga and Lipsitch in Proc Biol Sci. 22-02-2007 Vol 274:1609). They relate the reproduction number and the growth rate using the generation interval distribution and the moment generating function $M(s)$ of this distribution to end up with
$$R(t) = \frac{1}{M(-C(t))}$$
And for instance, with a gamma distribution you get $M(s) = (1-s \frac{\mu_{\tau}}{k} )^{-k}$ and
$$R(t) = \left( 1+ C(t) \frac{\mu_{\tau}}{k}\right)^{k} = 1 + C(t) \mu_{\tau} + \sum_{n=2}^\infty {k\choose n} \left(C(t) \frac{\mu_{\tau}}{k} \right)^n$$
which equals $ R(t) = 1 + C(t) \tau$ if $k = 1$ and will be approximately equal (to first order) when $|C(t)|\frac{\mu_{\tau}}{k} \ll 1$. (in the graph the generation interval is actually a degenerate distribution and you end up with $R = e^{\tau C(t)}$ instead of $ R(t) = 1 + C(t) \tau$)
Why $R(t)$ is useful
$R(t)$ relates to the chain reaction
The $R(t)$ value is important because it is closer to the underlying multiplicative mechanism of growth in terms of a chain reaction.
This chain reaction amplifies if each event causes multiple new events in a ratio above 1, if more infections are being created than infections being dissolved (creating a snowball effect). The reaction reduces when each event causes less than one new event.
In terms of the $\beta$ (rate of new infected people) and $\gamma$ (rate of infected people healing or dying) you get growth when $\beta > \gamma$. The reproduction rate $R = \beta / \gamma$ relates directly to changes in $\beta$ (which may change due to immunisation/vaccination or social distancing). If $\beta$ changes by a certain factor then $R$ changes by the same factor. For growth rate $C= \beta-\gamma$ it is less directly clear what the effect will be when $\beta$ changes.
For instance if $\beta$ reduces by half then this could represent a change of the growth rate $C=\beta-\gamma$ from $3 = 4-1$ to $1 = 2-1$, or it could just as well represent a change of growth rate from $3=9-6$ to $-1.5=4.5-6$. The growth rate on it's own does not allow to make the direct connection between relative changes in $\beta$ and how this influences the growth rate. On the other hand, the reproduction rate $R =\beta/\gamma$ changes in those situations from $4$ to $2$ or from $1.5$ to $0.75$ and expresses more clearly what will happen to the chain reaction (growth versus decrease) if the dynamics of the spread changes (which is more directly governed by $\beta$).
With the reproduction rate, which you can see as the multiplication factor in the chain reaction, we know better how the amplification changes in terms of changes in the virus dynamics. For instance, if the reproduction rate is 2 and due to measures (or due to more people becoming immune) the rate is reduced by halve then the reproduction will be 1 and the chain reaction will become neutralized.
The growth rate $C$ does not tell you by which factor you need to reduce the spread (the multiplication factor) in order to change the growth from increasing to decreasing. This is because the growth rate does not contain information about the multiplication factor in the underlying chain reaction.
The growth rate is therefore a more natural descriptor that explains how the virus spreads. It is an indication how the rate of spread multiplies in each generation.
Computation of herd immunity
A direct application is for instance in the use of computing the level of immunity that is necessary to reach herd immunity by means of random immunization (vaccination).
Future development of epidemiological curve
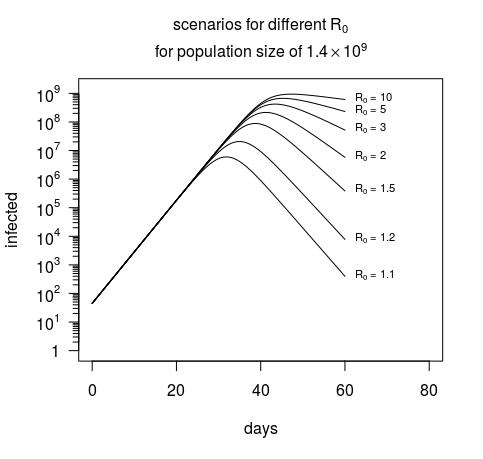
Another useful effect is that the reproduction rate is a better indicator than the growth rate in determining how many people will become infected before the spread reduces. In the graph you see the virus reproduces with a factor 2 each generation but this will slow down because other people get immune (and there will be less people to pass on the virus, the multiplication will decrease).
This is illustrated in the image below from this question which tried to fit the growth curves in order to find $R(0)$ but had troubles finding a good fit. One reason for the problem in the fitting is that you can have the same growth rate for different values of $R(0)$. But in the image you see also that further in time the $R(0)$ value has a strong impact on the epidemiological curve.

The slow down occurs earlier when the $R(t)$ is closer to 1 (when it is closer to 1 then it needs to drop relatively less much in order to get equal to 1 or below). The growth rate is no indication of how close the reproduction/multiplication rate is to 1. Alternatively you can see it in this way: because the growth rate is related as $C(t) \propto R(t) -1$, reducing the reproduction rate $R(t)$ by some factor will reduce the growth rate by a different factor.
Alternative measurements In addition, the $R(t)$ value may be computed either based on other epidemiological parameters (contact rates and such things), or measured 'in the field' by data on contact tracing.
Why $R(t)$ is not so usefull
The $R(t)$ value is a highly simplified measure. In most models, it represents an average reproduction, but the reality is that there is inhomogeneity and this may have a big influence on conclusions made in relation to $R(t)$ (the same arguments apply to $C(t)$).
- For instance, consider a population as a mixture of locally different $R(t)$ values. For this case bringing down the rate of spread by a factor of two will not bring down the average $R(t)$ from 2 to 1. There will be some buffering effect of regions with relatively higher local reproduction rates where the spread will keep going on. So, the measures that we take seem to get stuck to $R(t) \approx 1$. (also related is the effect discussed here)
- Another effect is that the computations for herd immunity are not correct because inhomogeneities mean that immunity will have different effect in different places (and lucky for us it is exactly those places where the spread is stronger and where immunization happens faster, that the immunization will have the strongest effect).
- In addition computations of $R_0$ may be wrong. Often they are based on the assumption that in the beginning $C(0) = (R_0-1)/\tau$. Then $R_0$ is determined based on measurements of $C(0)$ (the initial growth rate of the epidemiological curves) and $\tau$ (by determining the mean of the distribution of the serial interval). But this falsely assumes that all people are equally susceptible from the start.


