2
$\begingroup$

I'm not quite sure how I should fit a model that has two responses. The data consists of target (x,y) co-ordinates and actual (x,y) co-ordinates. I would like to fit a model to predict a new set of points from the target, however having two variables is putting me off.

There also appears to be no relationship between points so I'm not even sure what kind of modelling to do.

Would a multivariate Gaussian be appropriate?

edit: here is the link to the data: https://dl.dropbox.com/u/12945652/data.csv

sessionID       targetX         targetY         touchX          touchY          name    phone
253             0.034375        0.564606742     0.034375        0.584269663     Subject15       Iphone4
253             0.60625         0.901685393     0.625           0.907303371     Subject15       Iphone4
253             0.2875          0.764044944     0.253125        0.783707865     Subject15       Iphone4
253             0.25            0.814606742     0.228125        0.823033708     Subject15       Iphone4
253             0.059375        0.657303371     0.04375         0.679775281     Subject15       Iphone4
253             0.06875         0.91011236      0.05            0.963483146     Subject15       Iphone4
253             0.625           0.603932584     0.68125         0.643258427     Subject15       Iphone4
253             0.265625        0.530898876     0.26875         0.533707865     Subject15       Iphone4
253             0.596875        0.974719101     0.603125        0.963483146     Subject15       Iphone4
253             0.290625        0.533707865     0.25            0.530898876     Subject15       Iphone4
253             0.946875        0.575842697     0.98125         0.564606742     Subject15       Iphone4
253             0.825           0.54494382      0.909375        0.542134831     Subject15       Iphone4
253             0.4625          0.556179775     0.4875          0.570224719     Subject15       Iphone4
253             0.6875          0.814606742     0.70625         0.828651685     Subject15       Iphone4
253             0.734375        0.873595506     0.775           0.91011236      Subject15       Iphone4
$\endgroup$
8
  • $\begingroup$ You state that your response is pairs of (x,y) values, do you mean something like where an arrow hits a target relative to the bulls-eye? Are these intended to be two different measures of the same underlying construct? IE, can you say more about your situation & what your data represent? $\endgroup$ Commented Feb 18, 2013 at 19:09
  • 1
    $\begingroup$ Yes the data represents intended touch points which a user was aiming to touch on a smart phone. The response was the actual touch location registered by the phone. I'm trying to build a regression model which can predict the intended touch location from the recorded touch location. $\endgroup$
    – user557240
    Commented Feb 18, 2013 at 19:22
  • $\begingroup$ So something like multivariate regression? What are the predictors? $\endgroup$
    – Glen_b
    Commented Feb 18, 2013 at 22:46
  • $\begingroup$ The response variables are x,y co-ordinates called targetX and targetY whilst the explanatory variable is touchX and touchY. That's why I'm not very sure as there are 2 response variables. I've only ever seen multiple regression where there is one response. $\endgroup$
    – user557240
    Commented Feb 18, 2013 at 23:07
  • $\begingroup$ Would a linear model be adequate for this data? The model seems to fit very well, however even a quadratic models is showing as a good fit which is weird. $\endgroup$
    – user557240
    Commented Feb 20, 2013 at 19:32

1 Answer 1

1
$\begingroup$

You question really boils down to "is it worth doing multivariate regression".

Having had a look at your data, I think the answer is probably yes.

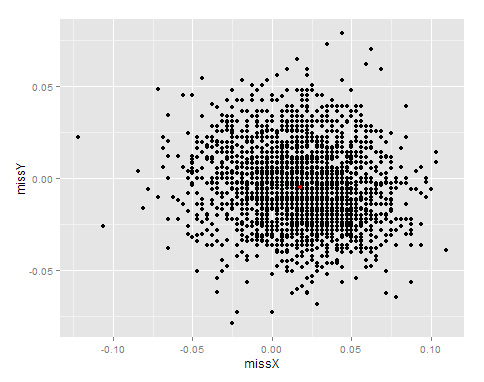
Obviously the gross feature of the data is that the touch is "near" to the target, so really it is the error that you are trying to predict, so I begin by adding two columns missX and missY. First let's look at the distribution of those misses

library(data.table)
library(ggplot)
dt = data.table(read.csv("data.csv"))
dt[, missX := touchX - targetX]
dt[, missY := touchY - targetY]
ggplot(dt) + geom_point(aes(missX, missY)) + 
         geom_point(aes(mean(missX),mean(missY)), color = "red")

Scatterplot of miss vectors

I have marked on the mean in red, and you can see that you have a noticeable bias in the X direction. Another thing to notice is you have quite significant quantization. The scatter plot looks fairly round, but with this much data it is best to check:

> dt[, cor.test(missX, missY)]

    Pearson's product-moment correlation

data:  missX and missY 
t = -7.1808, df = 2398, p-value = 9.206e-13
alternative hypothesis: true correlation is not equal to 0 
95 percent confidence interval:
 -0.1840298 -0.1056891 
sample estimates:
       cor 
-0.1450868 

This seems to suggest you do have correlation between the X and Y errors. This is important because this it the correlation that can be exploited by a multivariate model. Without it you could safely treat X and Y separately.

However, that isn't the end. If the only thing going on here was that each person had their own distinct correlated Gaussian cloud around the target, then simply learning the multivariate Gaussian distribution would be fine. On the other hand, if you have other predictive variables, then a regression model is needed.

> summary(lm(missX ~ targetX + phone, dt))

Call:
lm(formula = missX ~ targetX + phone, data = dt)

Residuals:
      Min        1Q    Median        3Q       Max 
-0.143017 -0.017294  0.002254  0.019252  0.092122 

Coefficients:
            Estimate Std. Error t value Pr(>|t|)    
(Intercept) 0.012678   0.001348   9.402  < 2e-16 ***
targetX     0.005927   0.002136   2.775  0.00557 ** 
phoneN9     0.004408   0.001195   3.689  0.00023 ***
---
Signif. codes:  0 ‘***’ 0.001 ‘**’ 0.01 ‘*’ 0.05 ‘.’ 0.1 ‘ ’ 1 

Residual standard error: 0.02927 on 2397 degrees of freedom
Multiple R-squared: 0.00894,    Adjusted R-squared: 0.008113 
F-statistic: 10.81 on 2 and 2397 DF,  p-value: 2.118e-05 

A quick check with lm shows that the N9 has a different X error to the iPhone and that the distribution changes as the target moves across the screen (people appear to overshoot away from the center of the screen).

Taken together this suggests to me that you should try to model the miss-touching as a multivariate model, estimating X and Y at the same time. There are a number of different way of approaching this.
Partial least squares for example would find the single common factor between the output pairs and input variables, or Reduced Rank Regression would try to do something similar. Perhaps a better method (at least according to the paper) is the Curds & Whey method proposed by Breiman and Friedman in this paper: Predicting Multivariate Responses in Multiple Linear Regression

$\endgroup$
1
  • $\begingroup$ Thank you very much. I did end up using a Gaussian Process. Thanks once again for the detailed answer. $\endgroup$
    – user557240
    Commented Mar 4, 2013 at 18:46

Your Answer

By clicking “Post Your Answer”, you agree to our terms of service and acknowledge you have read our privacy policy.

Not the answer you're looking for? Browse other questions tagged or ask your own question.