1
$\begingroup$

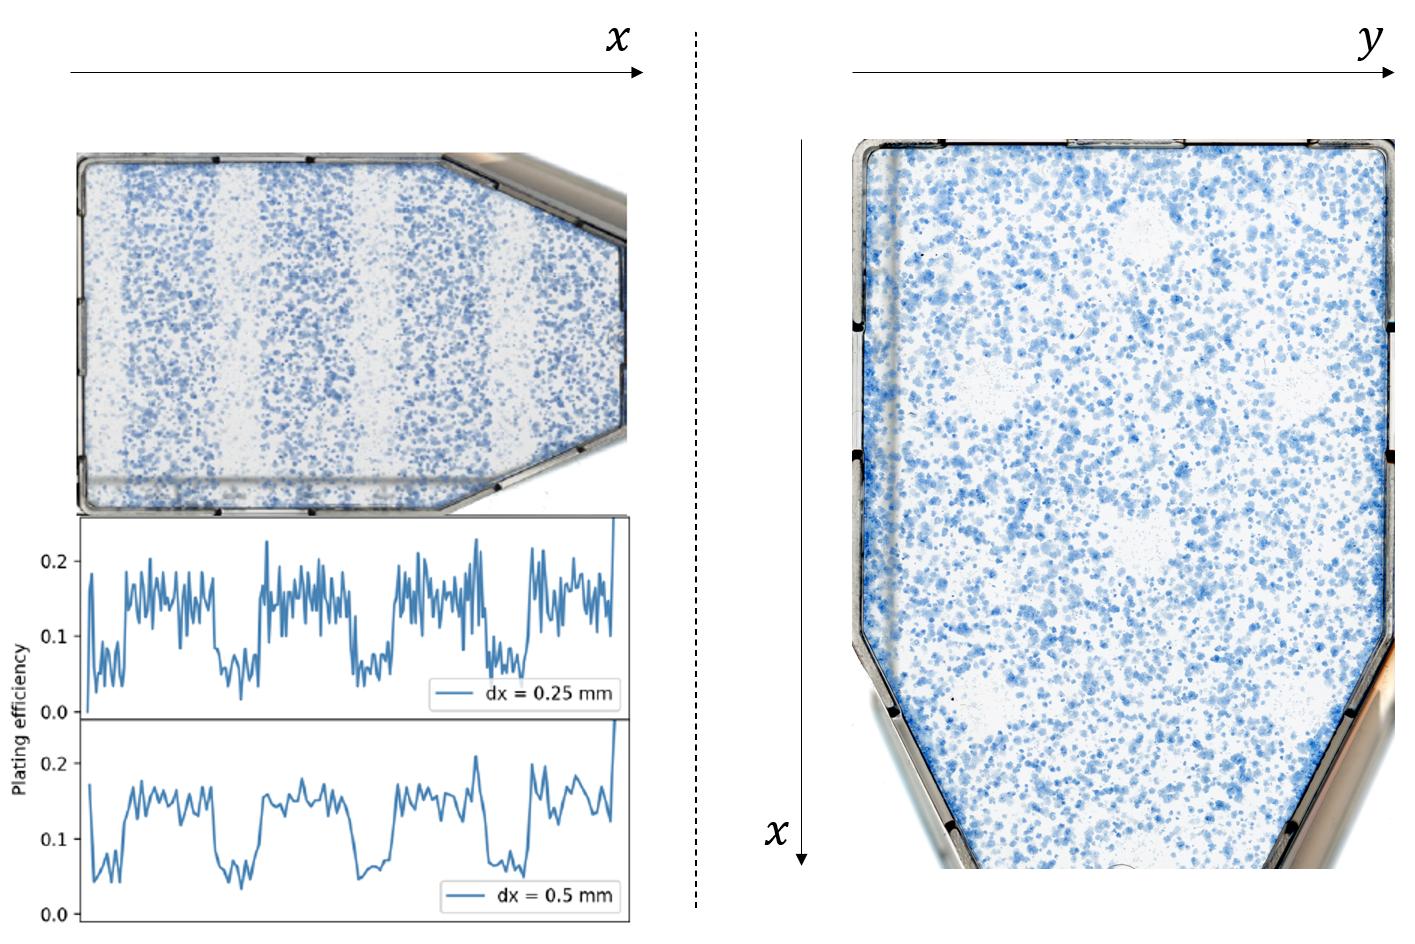
I am attempting to spatially map the cell survival in a given scanned image of a cell flask. Quick background: the cells have received a high dose of irradiation (protons/X-rays) delivered through a grid so that some regions are covered from the irradiation, whereas other regions are not. After scanning such cell colonies, the images are then fed into a segmentation algorithm (in which I have developed using Matlab), centroid coordinates ($c_i = (x_i,y_i)$) of each detected viable colony are provided.

I have done this type of assessment for grid ‘stripes’, where I have counted colonies within a band along a single dimension ($x$) and tested for different band widths $\Delta x$ (as shown in the left figure below). However, my issue is for grid ‘holes’ (see right figure below) – how can I perform the same type of assessment for cell colony survival in two dimensions ($x$ and $y$) given the centroid coordinates? Do I have to “think” radially?

Thank you in advance for any guidance or help to this problem.

enter image description here

$\endgroup$
4
  • $\begingroup$ Please include the figures you reference. $\endgroup$
    – whuber
    Commented Feb 11, 2021 at 21:02
  • $\begingroup$ The figure is uploaded - any suggestions? Apologies if this question is poorly formulated $\endgroup$
    – tehm0n
    Commented Feb 16, 2021 at 13:09
  • $\begingroup$ Thank you: as I had hoped, it's a fascinating problem. Do you know what the hole diameters ought to be beforehand? How about the number of holes? Their locations? $\endgroup$
    – whuber
    Commented Feb 16, 2021 at 14:31
  • $\begingroup$ Thank you for the response! The geometry of the holes are, sort of, preset by using a tungsten collimator with either stripe or circular openings to pass the irradiation in such pattern. The diameter of each hole opening is 5 mm, while there will always be 7 holes at the presented locations when the tungsten collimator is placed directly on top of the flask. $\endgroup$
    – tehm0n
    Commented Feb 17, 2021 at 8:05

1 Answer 1

1
$\begingroup$

You might want to look into the quadrat count method. It simply imposes a regular grid on top of your set of points and counts the number if points in each square. This pdf contains some background and a few examples to get you started.

The method is part of the larger field point pattern analysis.

$\endgroup$
2
  • $\begingroup$ Thanks for the suggestion - it can give some additional quantitative measure about the dispersion of the centroid points, but I need somehow to describe the spatial variation pattern of the viable cell colonies and also take into account the distance between the detected colonies. Furthermore, if to use the quadrat analyses, what cell size should I use? Should it complement the median pixel area of the detected colonies (which my Matlab script also provide)? $\endgroup$
    – tehm0n
    Commented Feb 17, 2021 at 15:50
  • 1
    $\begingroup$ Quadrat count will help you to establish statistically that there is some effect. Grid size will affect the result so try a few different ones and see if you get the same answer. If you add Moran's I to the analysis you will also quantify spatial autocorrelation. If you just want to visualize what is going on, just do a quadrat count and make a surface where the number of cells in a square gives z, try this with different grids as well. If you want to characterize the cells a spatial point pattern there is a few methods here $\endgroup$
    – Samuel
    Commented Feb 17, 2021 at 21:59

Your Answer

By clicking “Post Your Answer”, you agree to our terms of service and acknowledge you have read our privacy policy.

Not the answer you're looking for? Browse other questions tagged or ask your own question.