2
$\begingroup$

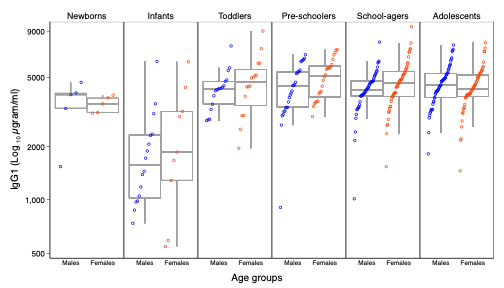
I have transformed levels of antibodies into log10. I use log10 for my figures. I would like to run wilcoxon rank sum test to see if there are differences between boys and girls in each age group in regards to antibody levels. Should I continue to use log10 or raw values?

Furthermore, I would like to run Kruskal wallis and dunn's test-since these are also nonparametric tests, it's safe to say that your consensus for the mode of action regarding Wilcoxon will apply here too - correct?

antibody levels according to age groups and sex

$\endgroup$
2
  • 6
    $\begingroup$ To at least answer the first part of your question, note that the Wilcoxon rank sum test only uses information about if one value is greater than another value or not. Note that the log transformation is monotonic in the sense that $X > Y \implies \log(X) > \log(Y)$. Thus, the outcome of such a test is unaffected by this transformation, so it does not matter. $\endgroup$ Commented Mar 26, 2021 at 0:07
  • 2
    $\begingroup$ The Kruskall-Wallis test is a generalization of Wilcoxon test when you have more than two groups to compare. If you only compare girls vs boys, Kruskall-Wallis test and Wilcoxon test should be equivalent. But anyway, as for the Wilcoxon test, the Kruskall-Wallis test is not affected by log-transform, as explained by stats_model. $\endgroup$
    – Pohoua
    Commented Mar 26, 2021 at 1:22

1 Answer 1

1
$\begingroup$

Here are fake data. First with data analogous to your logged data. My purpose is to illustrated @stats_model's comment. The Wilcoxon test cares only about the ranks of your data which are not changed by monotone transformations.

set.seed(2021)
b = rnorm(15, 5, .6)
g = rnorm(16, 6, .65)

wilcox.test(b,g)

        Wilcoxon rank sum test

data:  b and g
W = 66, p-value = 0.03305
alternative hypothesis: 
 true location shift is not equal to 0

Second with data analogous to your original un-logged data. Notice that the P-value is exactly the same either way.

B = 10^b; G = 10^g
wilcox.test(B,G)

        Wilcoxon rank sum test

data:  B and G
W = 66, p-value = 0.03305
alternative hypothesis: 
  true location shift is not equal to 0

Here are boxplots of your data:

par(mfrow=c(1,2))
 boxplot(b,g, col="skyblue2", pch=20, main="b and g")
 boxplot(B,G, col="skyblue2", pch=20, main="B and G")
par(mfrow=c(1,1))
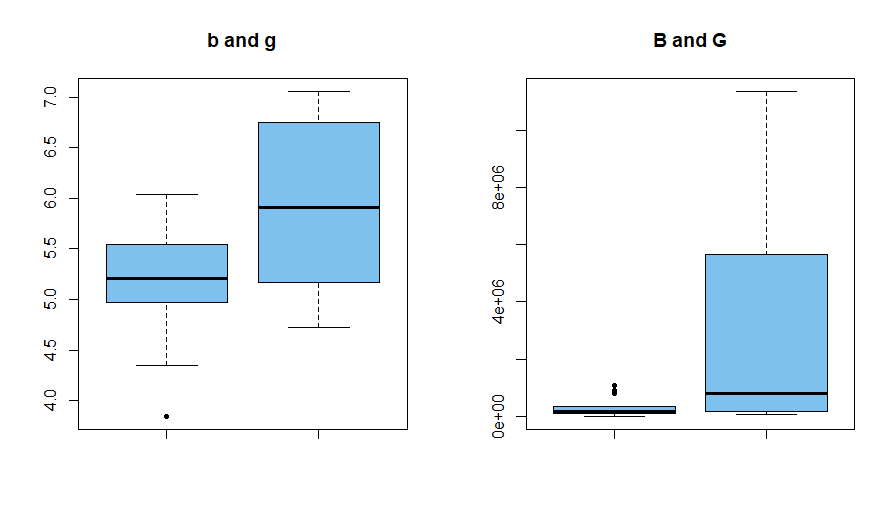
enter image description here

However, results are very different with Welch t tests. Because I simulated b and g to be normal data, the first test is accurate. But the second, is using nonnormal data so the P-value should not be taken seriously. Also, the Welch test reduces the degrees of freedom in the second test to account for extremely different variances between B and G.

t.test(b,g)

        Welch Two Sample t-test

data:  b and g
t = -2.7628, df = 27.238, p-value = 0.01015
alternative hypothesis: true difference in means is not equal to 0
95 percent confidence interval:
 -1.2258077 -0.1812623
sample estimates:
mean of x mean of y 
 5.198991  5.902526 

t.test(B,G)

        Welch Two Sample t-test

data:  B and G
t = -2.6203, df = 15.24, p-value = 0.01911
alternative hypothesis: true difference in means is not equal to 0
95 percent confidence interval:
 -4745427.1  -491396.2
sample estimates:
mean of x mean of y 
 307345.8 2925757.5 
$\endgroup$

Your Answer

By clicking “Post Your Answer”, you agree to our terms of service and acknowledge you have read our privacy policy.

Not the answer you're looking for? Browse other questions tagged or ask your own question.