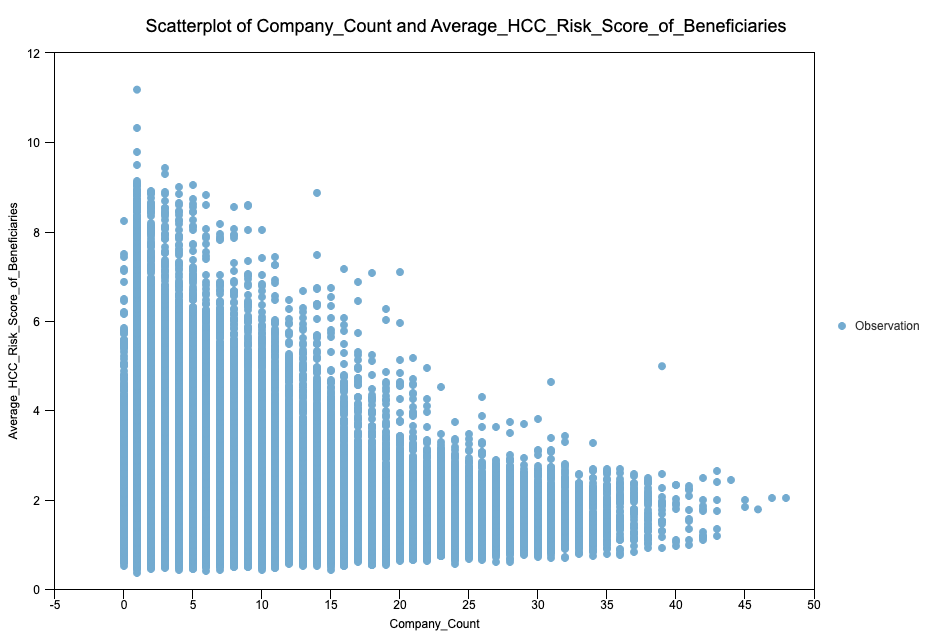
The picture below is the dependent variable on the Y and one of the IVs on the X axis. The Dependent variable is range bound between .5 and 12 while the IVs range from 0-over a million depending on the IV. When log base 10 transformed the Q-Q plot is very slightly right skewed compared to the non-transformed data that is very heavily right skewed. The dataset is around 250,000 data points and I am looking to ensure linearity requirement is met in order to perform linear regression.
Thanks,

